


FXOpen
GBP/USD failed to stay above 1.3800 and extended its decline. USD/CAD is showing positive signs, but it must clear 1.2570 for a decent increase in the near term.
Important Takeaways for GBP/USD and USD/CAD
- The British Pound started a fresh decline from well above the 1.3850 support zone.
- There is a key declining channel forming with resistance near 1.3715 on the hourly chart of GBP/USD.
- USD/CAD found support near the 1.2525 zone and it is now recovering higher.
- Earlier, there was a break below a key contracting triangle with support near 1.3565 on the hourly chart.
GBP/USD Technical Analysis
This past week, the British Pound failed to stay above the 1.3850 and 1.3800 support levels against the US Dollar. As a result, the GBP/USD pair started a fresh decline and it even broke the 1.3750 support zone.
There was a close below the 1.3750 level and the 50 hourly simple moving average. The pair declined below the 1.3700 level and it traded as low as 1.3670. Recently, there was an upside correction above 1.3700, but the pair struggled to clear the 1.3750 zone.
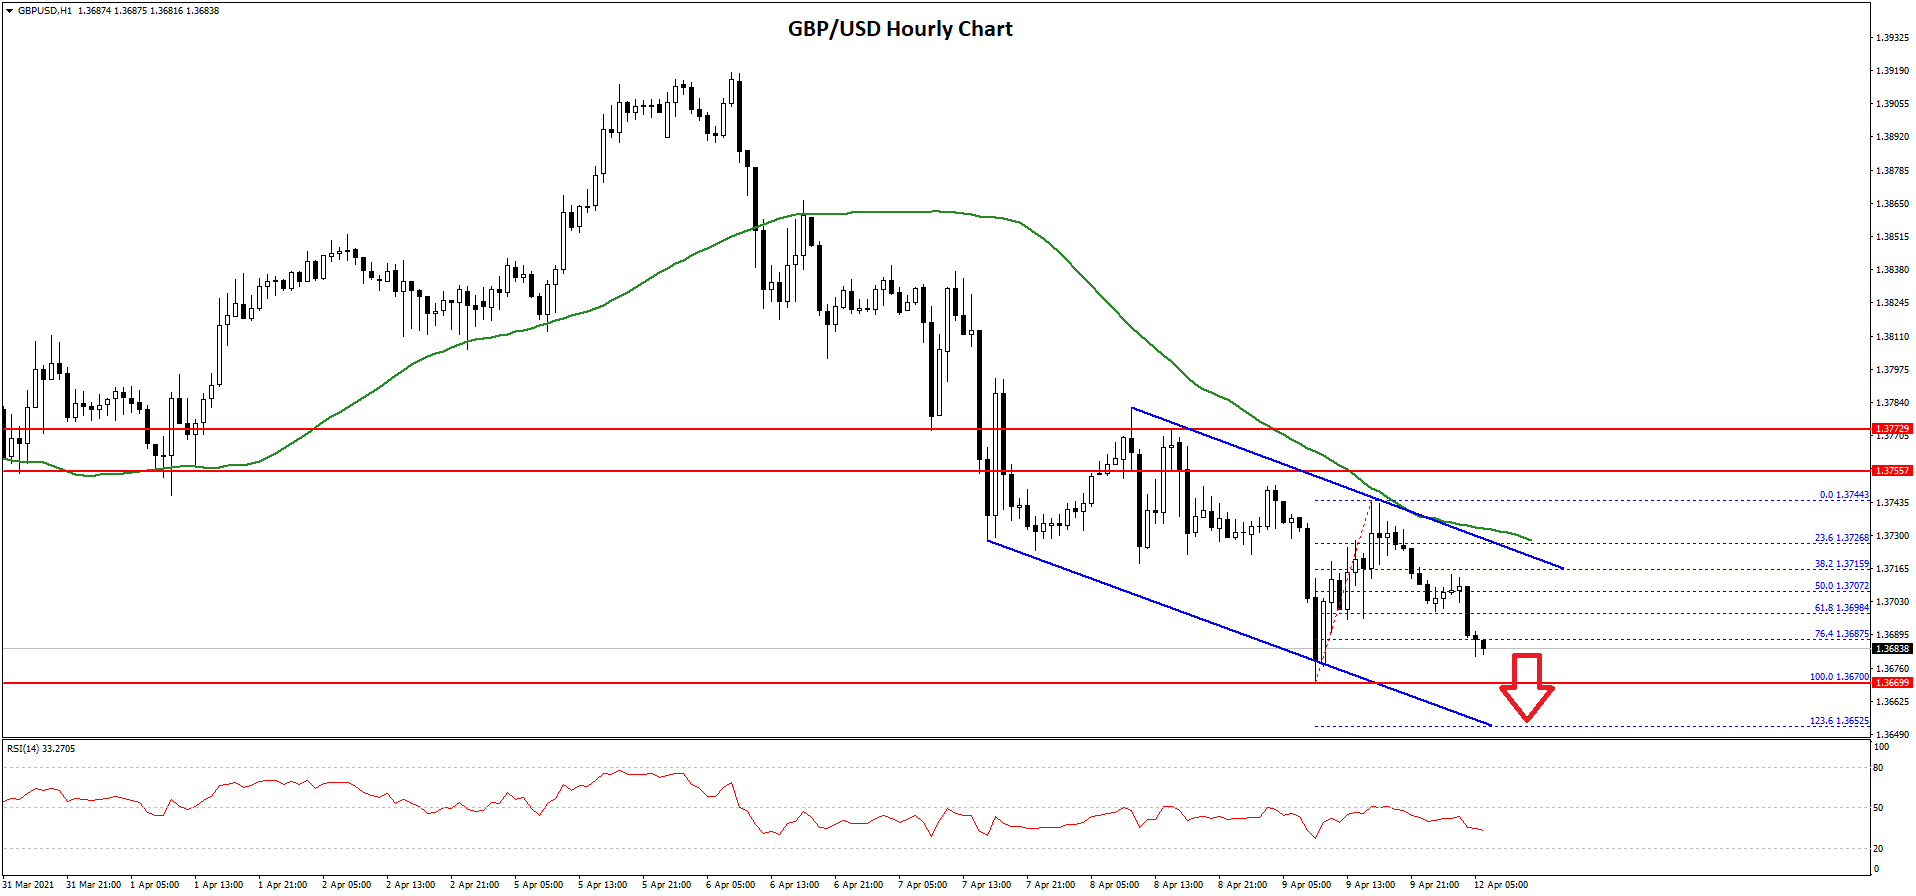
A high was formed near 1.3744 and the pair is now declining. It broke the 50% Fib retracement level of the upward move from the 1.3670 low to 1.3744 high.
There is also a key declining channel forming with resistance near 1.3715 on the hourly chart of GBP/USD. The pair is now trading near the 76.4% Fib retracement level of the upward move from the 1.3670 low to 1.3744 high.
It seems like the pair might continue to move down below the 1.3670 support zone. The next major support is near the 1.3620 level, below which the pair might test 1.3580.
On the upside, the 1.3720 zone is a major hurdle along with the 50 hourly simple moving average. A successful close above the 1.3720 and 1.3750 levels could open the doors for a decent increase in the coming sessions.
USD/CAD Technical Analysis
The US Dollar started a major decline after it failed to clear the 1.2630 resistance zone against the Canadian Dollar. The USD/CAD pair broke many supports near the 1.2600 and 1.2580 levels.
There was also a break below a key contracting triangle with support near 1.3565 on the hourly chart. The pair traded as low as 1.2526 and settled below the 50 hourly simple moving average. It is now recovering higher and trading above 1.2545.
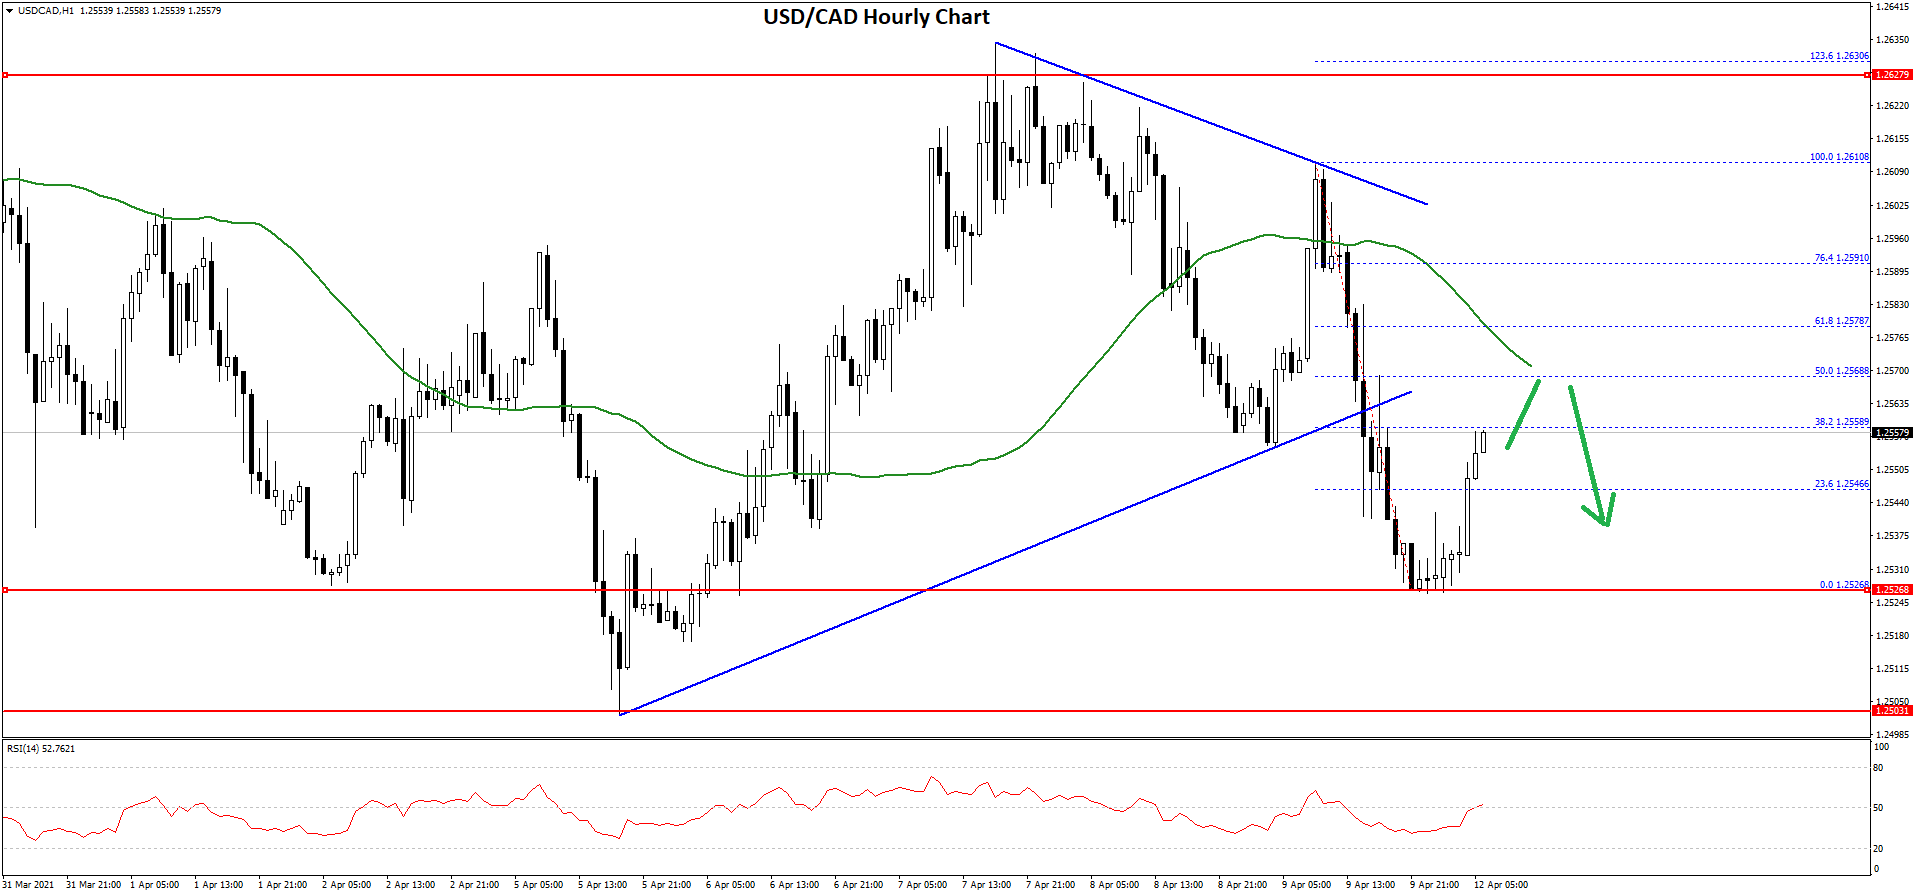
It is testing the 38.2% Fib retracement level of the recent decline from the 1.2610 high to 1.2526 low. The first major resistance is near the 1.2570 level and the 50 hourly simple moving average.
It is close to the 50% Fib retracement level of the recent decline from the 1.2610 high to 1.2526 low. Therefore, a successful break and close above the 1.2570 resistance level could lead the pair towards the 1.2620 and 1.2630 levels.
If not, there is a risk of a fresh decline from the 1.2570 zone. An initial support is near the 1.2540 level. The main support is now forming near the 1.2525 level. A downside break below the 1.2525 support may possibly lead the pair towards the 1.2500 zone. The next major support sits near the 1.2460 level.
Trade over 50 forex markets 24 hours a day with FXOpen. Take advantage of low commissions, deep liquidity, and spreads from 0.0 pips. Open your FXOpen account now or learn more about trading forex with FXOpen.
This article represents the opinion of the Companies operating under the FXOpen brand only. It is not to be construed as an offer, solicitation, or recommendation with respect to products and services provided by the Companies operating under the FXOpen brand, nor is it to be considered financial advice.
Latest from Forex Analysis
Latest articles

USD to CAD Analytical Predictions in 2024, 2025 and Beyond
This comprehensive article delves into the intricacies of the USD to CAD exchange rate, exploring the factors that may influence its trajectory in 2024, 2025, and beyond. From economic outlooks to key market drivers, this article provides valuable insights for

France Joins European Stock Boom as CAC 40 Index Heads for Highs
This decade has been full of market-disrupting surprises, placing it as completely different to any other decade experienced by residents of Western Europe and North America since the end of the Second World War.
The only constant dynamic since the

Gold Price (XAU/USD) Is Testing an Important Resistance Zone
On April 16, we wrote why the $2,380 zone is an important resistance area.

The XAU/USD chart shows that:
1) After fading fluctuations (they formed a narrowing consolidation triangle - shown in green), the price of gold dropped