


FXOpen

GBP/USD started a decent recovery wave from the 1.3750 support zone. USD/CAD must clear the 1.2500 resistance zone to continue higher in the near term.
Important Takeaways for GBP/USD and USD/CAD
- The British Pound started a fresh increase from the 1.3750 support zone.
- There was a break above a key bearish trend line with resistance near 1.3775 on the hourly chart of GBP/USD.
- USD/CAD gained bullish momentum above the 1.2450 and 1.2500 resistance levels.
- There is a major bearish trend line forming with resistance near 1.2480 on the hourly chart.
GBP/USD Technical Analysis
The British Pound formed a strong support base above the 1.3750 level against the US Dollar. As a result, the GBP/USD pair started a decent increase and it broke many hurdles near 1.3800.
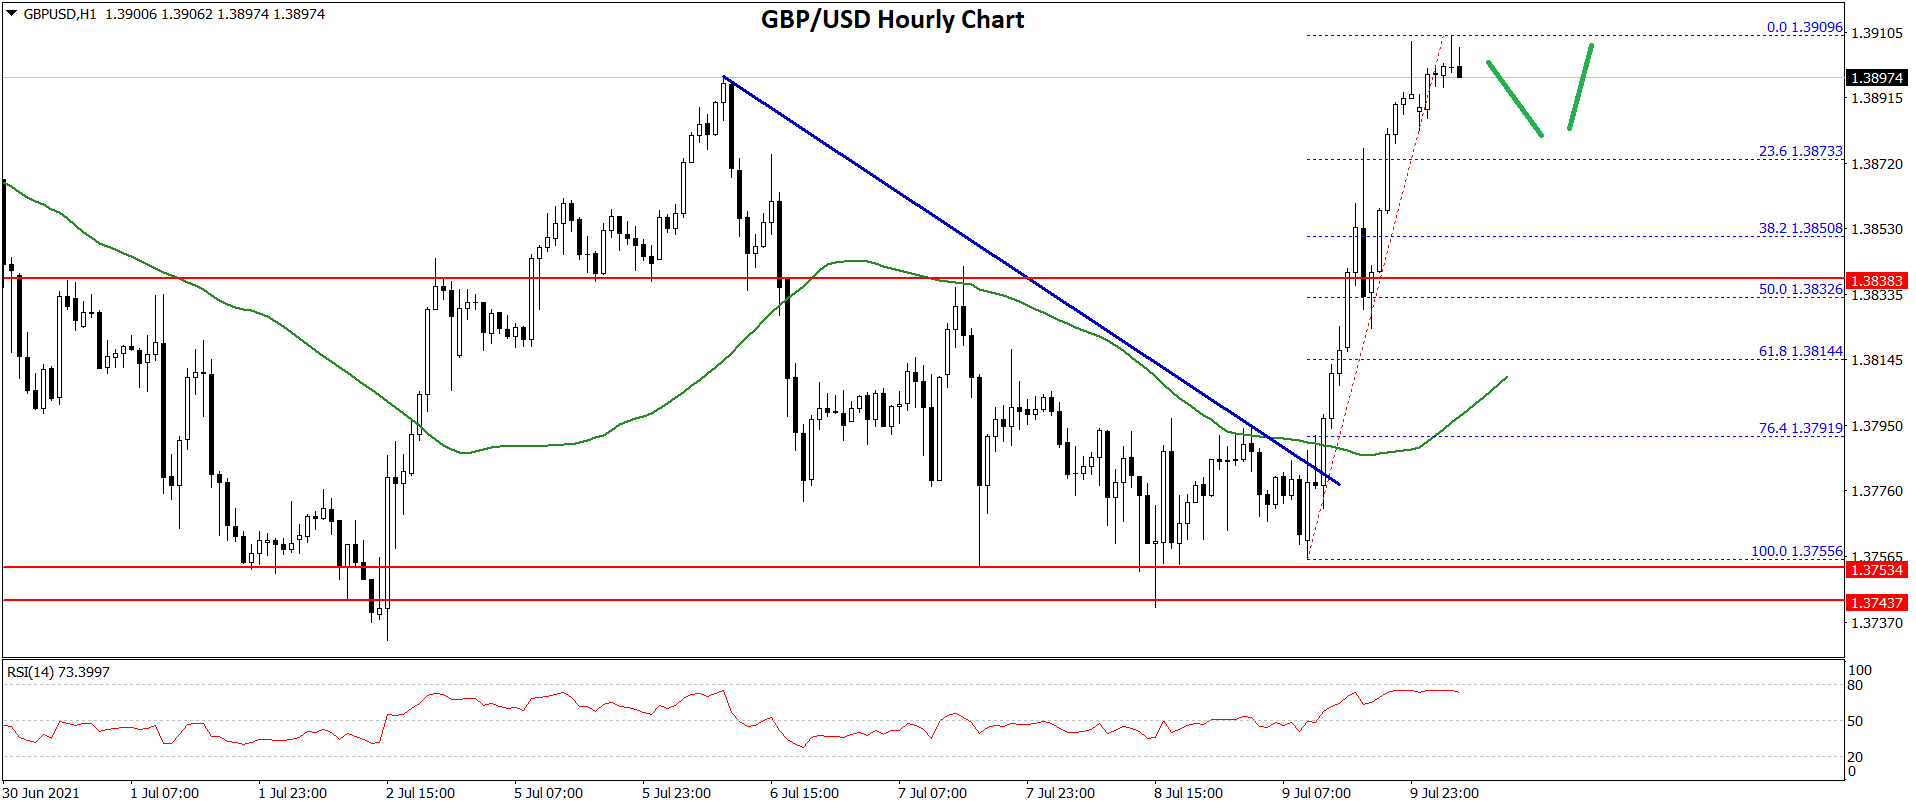
There was a break above a key bearish trend line with resistance near 1.3775 on the hourly chart of GBP/USD. The pair gained pace above the 1.3820 level and the 50 hourly simple moving average.
The pair even spiked above the 1.3900 resistance zone. A high is formed near 1.3909 on FXOpen and the pair is now consolidating gains. An initial support on the downside is near the 1.3875 level. It is near the 23.6% Fib retracement level of the upward move from the 1.3755 swing low to 1.3909 high.
The main support is now forming near the 1.3830 level. It is close to the 50% Fib retracement level of the upward move from the 1.3755 swing low to 1.3909 high.
On the upside, the pair must settle above the 1.3900 level. The next major resistance is near the 1.3940 level. Any more gains could lead the pair towards the 1.4000 barrier in the near term. An intermediate resistance could be 1.3980.
USD/CAD Technical Analysis
The US Dollar formed a strong support base above the 1.2300 and 1.2310 levels against the Canadian Dollar. The USD/CAD pair started a major increase and it broke the 1.2400 resistance zone.
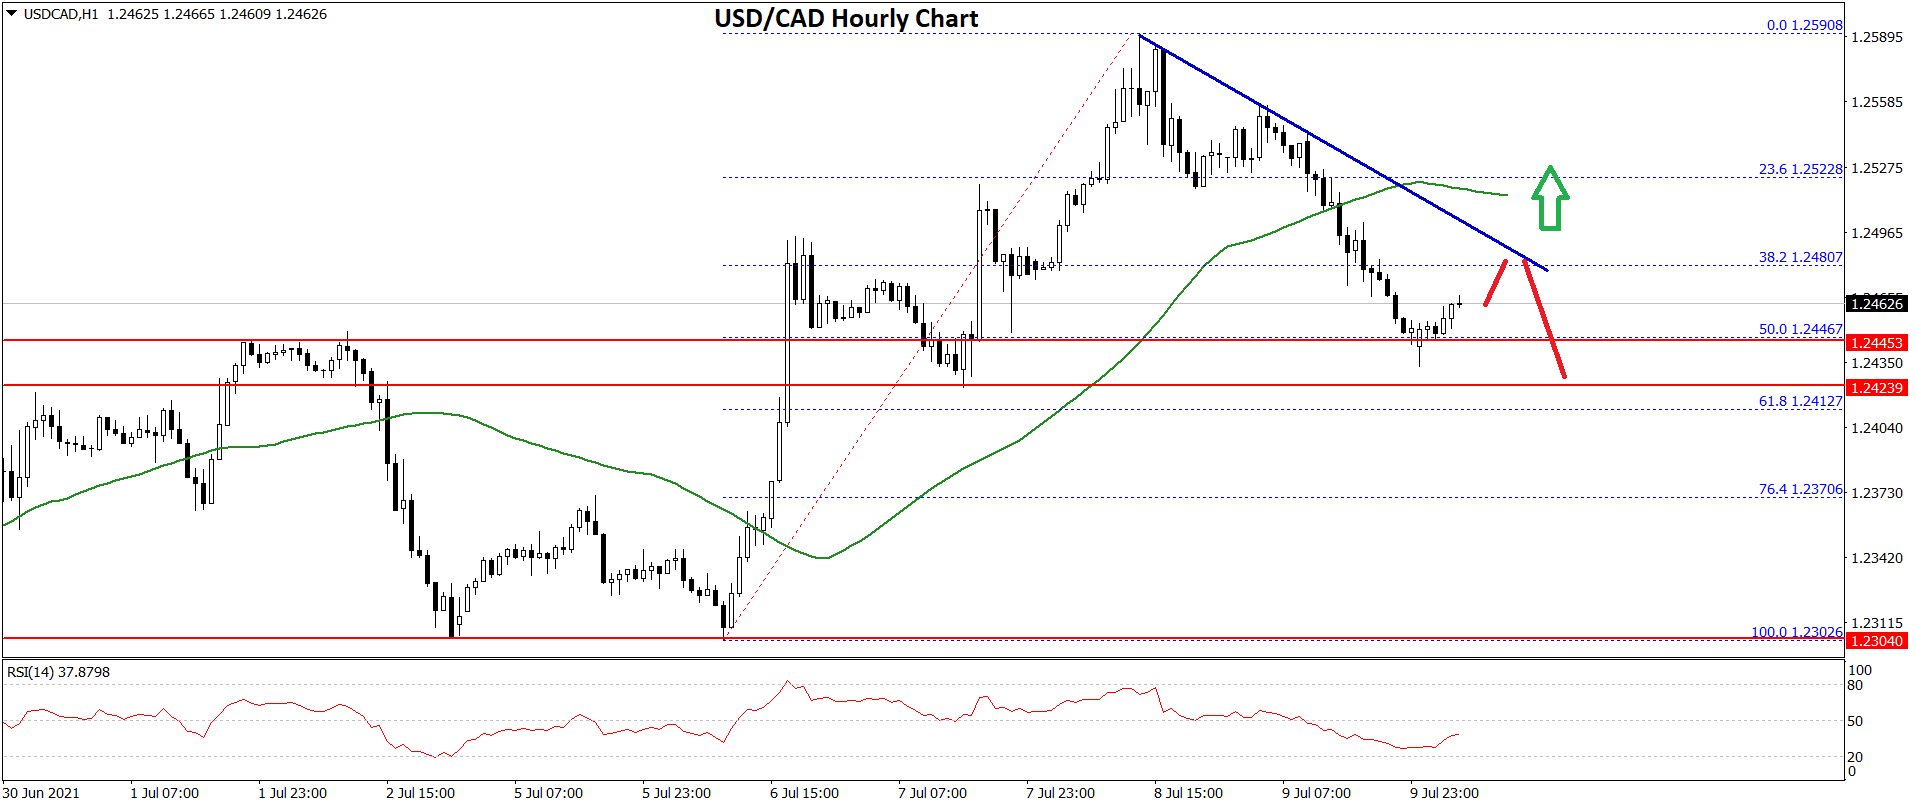
The pair gained pace for a move above the 1.2500 level and the 50 hourly simple moving average. Finally, there was a break above the 1.2550 level and the pair traded as high as 1.2590.
Recently, there was a downside correction below the 1.3500 support zone. The pair even spiked below the 50% Fib retracement level of the upward move from the 1.2302 low to 1.2590 high.
It is now consolidating above the 1.2440 support zone. On the upside, the pair is facing hurdles near 1.2480 and 1.2500. There is also a major bearish trend line forming with resistance near 1.2480 on the hourly chart.
An upside break above the 1.3500 resistance zone could open the doors for a fresh increase. The next major resistance is near the 1.3550 level, above which the pair could rise towards the 1.3620 level.
This forecast represents FXOpen Markets Limited opinion only, it should not be construed as an offer, invitation or recommendation in respect to FXOpen Markets Limited products and services or as financial advice.
Trade over 50 forex markets 24 hours a day with FXOpen. Take advantage of low commissions, deep liquidity, and spreads from 0.0 pips. Open your FXOpen account now or learn more about trading forex with FXOpen.
This article represents the opinion of the Companies operating under the FXOpen brand only. It is not to be construed as an offer, solicitation, or recommendation with respect to products and services provided by the Companies operating under the FXOpen brand, nor is it to be considered financial advice.
Latest from Forex Analysis
Latest articles

Weekly Market Wrap With Gary Thomson: S&P500, US Dollar, Gold Price, PEP Stocks
Get he latest scoop on the week's hottest headlines, all in one convenient video. Join Gary Thomson, the COO of FXOpen UK, as he breaks down the most significant news reports and shares his expert insights. Read the latest news

The Price of Silver Has Reached Its Highest Level in Over Three Years
As indicated by the XAG/USD chart today, the intraday price of silver reached $29.84 per ounce yesterday, while the previous yearly high on 12 April was $29.79. The last time this price was seen was in February

What Is the Wolfe Wave, and How Can You Trade It?
The Wolfe Waves is a powerful chart pattern recognised for analysing potential price reversals. Named after Bill Wolfe, who developed this formation through extensive trading practice, Wolfe Waves provide traders with a structured approach to anticipate market movements. In this