


FXOpen
GBP/USD started a fresh increase and it broke the 1.3880 resistance. USD/CAD is recovering, but it is facing hurdles near 1.2520.
Important Takeaways for GBP/USD and USD/CAD
- The British Pound started a steady increase above the 1.3850 and 1.3880 resistance levels.
- There is a key bullish trend line forming with support near 1.3875 on the hourly chart of GBP/USD.
- USD/CAD started a steady decline below the 1.2550 and 1.2520 support levels.
- There was a break above a short-term declining channel with resistance near 1.2455 on the hourly chart.
GBP/USD Technical Analysis
After forming a base above the 1.3620 level, the British Pound started a decent increase against the US Dollar. The GBP/USD pair broke the 1.3750 resistance level to move into a positive zone.
The bulls gained pace above the 1.3850 level and the 50 hourly simple moving average. The pair even broke the 1.3950 resistance level. A high was formed near 1.3981 on FXOpen and it is currently correcting lower.
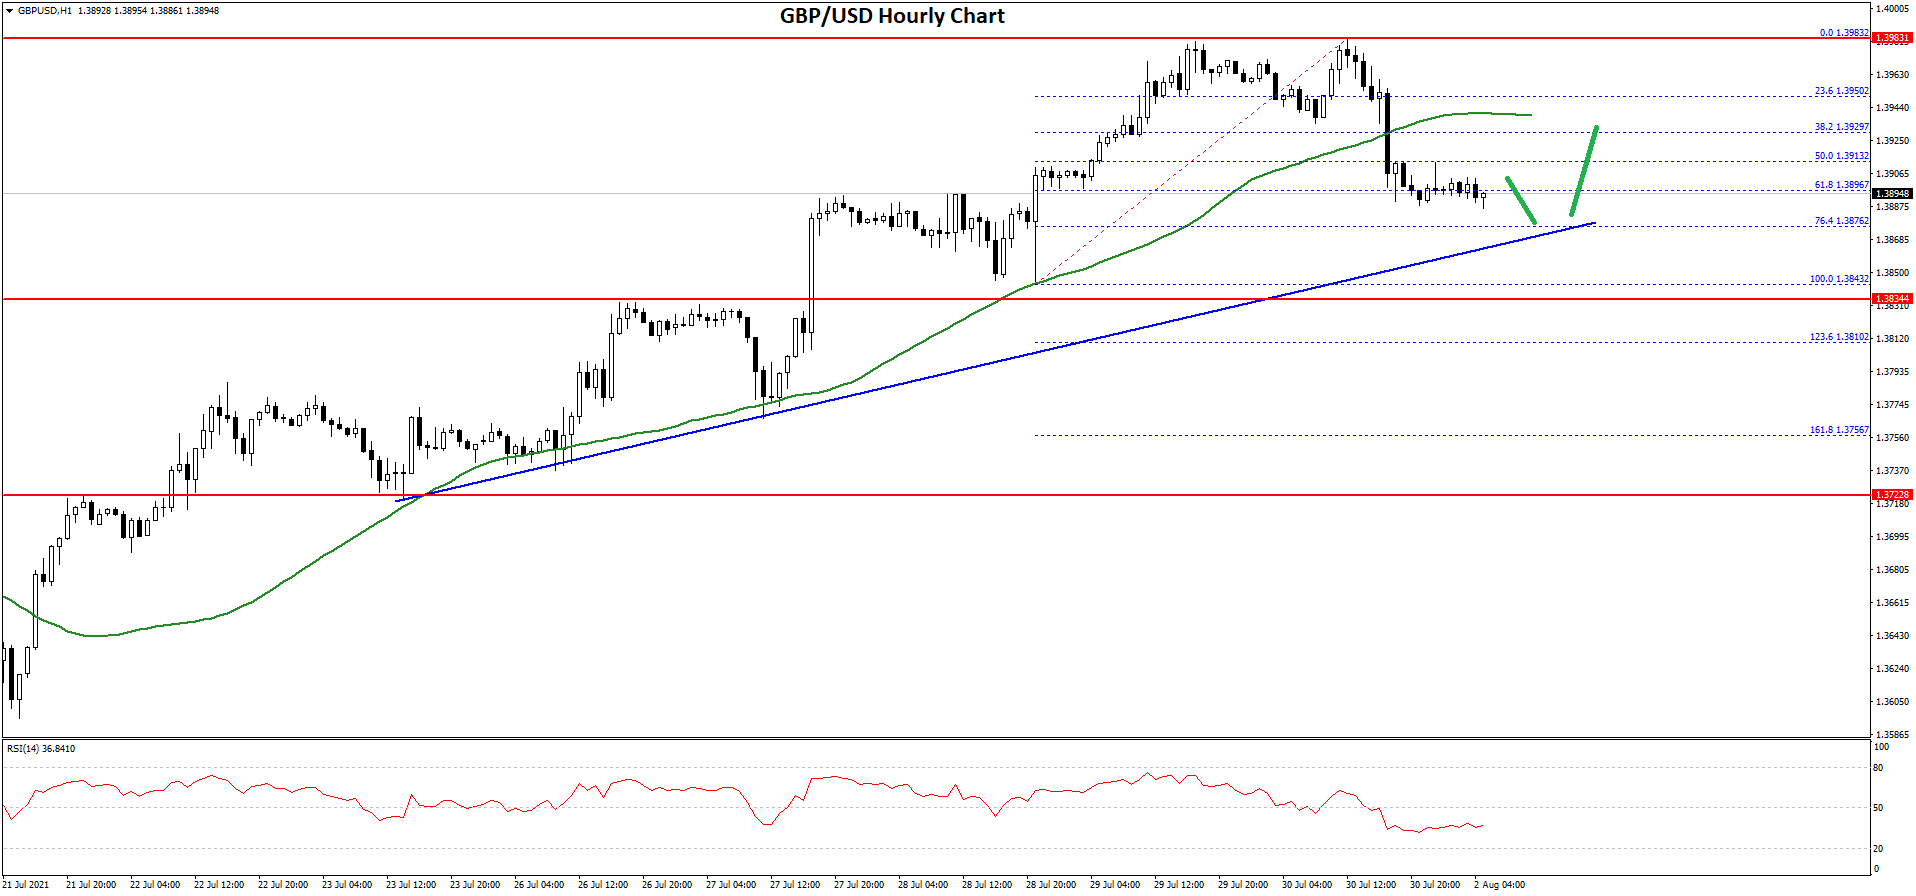
There was a break below the 1.3950 support level. The pair traded below the 50% Fib retracement level of the recent move from the 1.3843 swing low to 1.3981 high.
On the downside, the first key support is near the 1.3875 area. There is also a key bullish trend line forming with support near 1.3875 on the hourly chart of GBP/USD. The trend line is close to the 76.4% Fib retracement level of the recent move from the 1.3843 swing low to 1.3981 high.
If there is a break below 1.3875 and 1.3860, the pair could decline towards the 1.3825 support zone. Any more losses might call for a test of the 1.3720 support.
On the upside, an initial resistance is near the 1.3940 level. The first major resistance is near the 1.3980 level. The main resistance is now near the 1.4000 zone, above which the pair is likely to accelerate higher towards the 1.4050 and 1.4100 levels.
USD/CAD Technical Analysis
The US Dollar struggled to clear the 1.2600 resistance zone against the Canadian Dollar. As a result, the USD/CAD pair started a steady decline below the 1.2550 and 1.2520 support levels.
It even traded below the 1.2500 support level and settled well below the 50 hourly simple moving average. A low is formed near 1.2422 and the pair is now correcting losses.
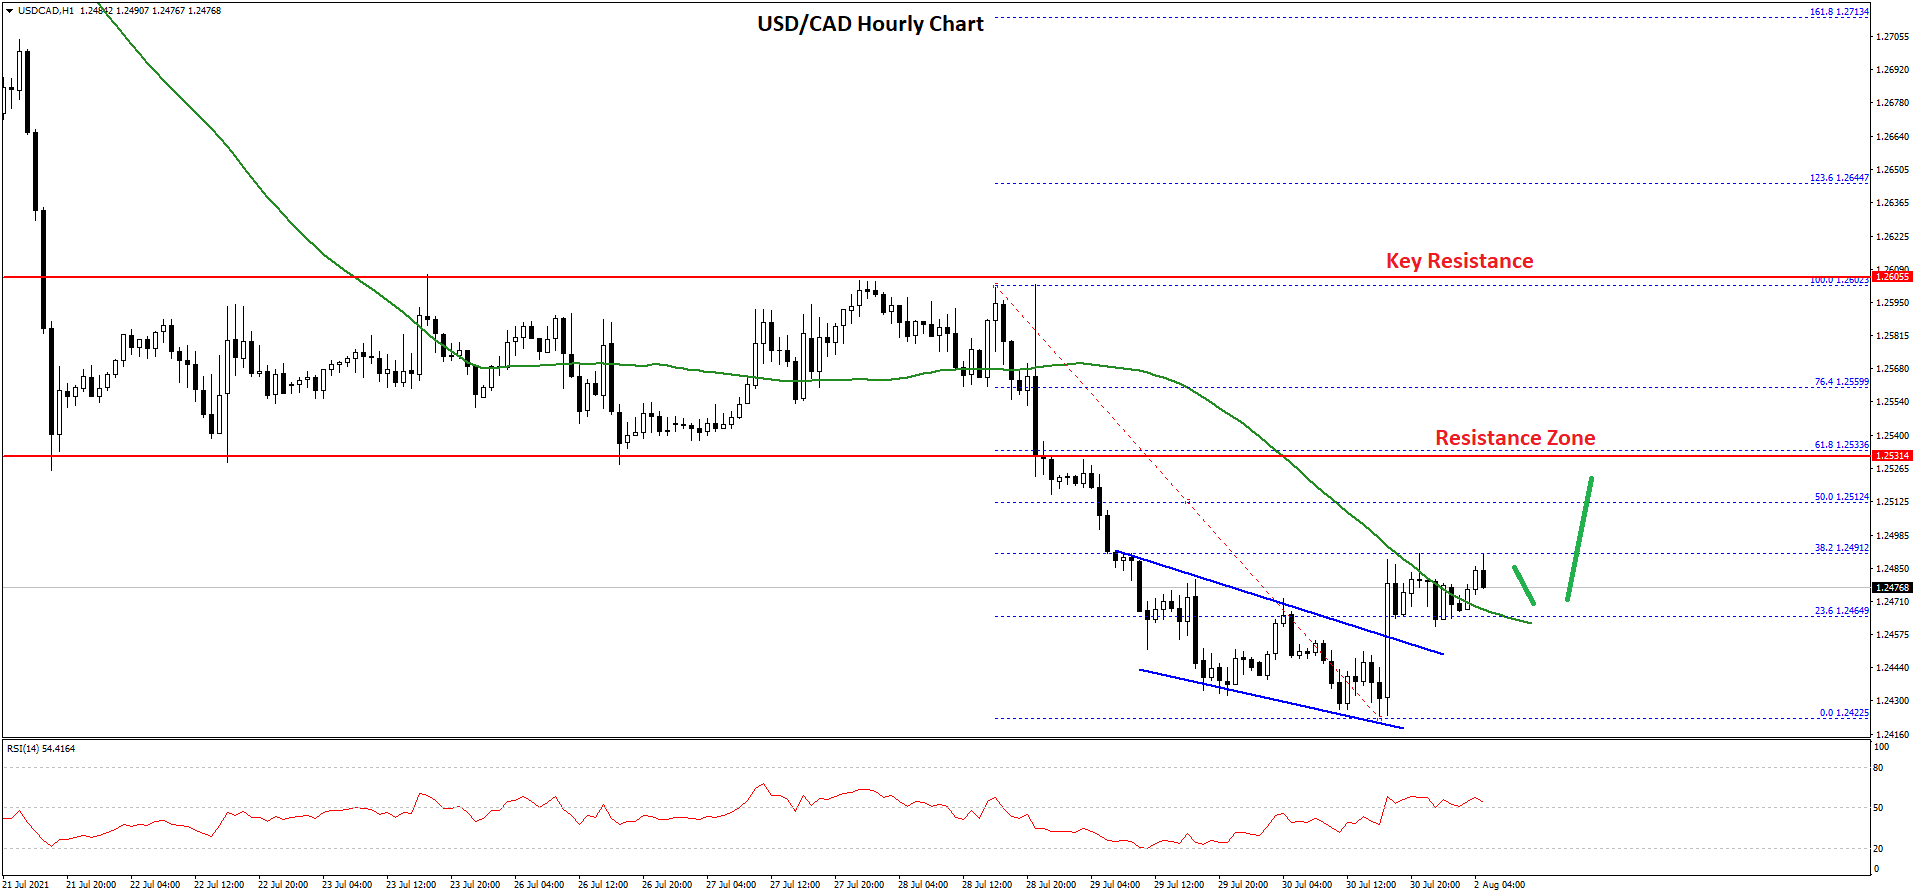
There was a break above the 1.2450 resistance level. The pair surpassed the 23.6% Fib retracement level of the downward move from the 1.2602 high to 1.2422 low. There was also a break above a short-term declining channel with resistance near 1.2455 on the hourly chart.
The pair is now trading above the 1.2470 level and the 50 hourly simple moving average. An immediate resistance is near the 1.2490 level. The first major resistance is near the 1.2512 level.
The 50% Fib retracement level of the downward move from the 1.2602 high to 1.2422 low is also near the 1.2512 level. The main resistance is now forming near the 1.2530 level. To move into a positive zone, the pair must clear the 1.2530 resistance zone.
On the downside, an initial support is near the 1.2450 level. The next major support is near the 1.2425 level. Any more losses may possibly open the doors for a drop towards the 1.2365 support.
This forecast represents FXOpen Markets Limited opinion only, it should not be construed as an offer, invitation or recommendation in respect to FXOpen Markets Limited products and services or as financial advice.
Trade over 50 forex markets 24 hours a day with FXOpen. Take advantage of low commissions, deep liquidity, and spreads from 0.0 pips. Open your FXOpen account now or learn more about trading forex with FXOpen.
This article represents the opinion of the Companies operating under the FXOpen brand only. It is not to be construed as an offer, solicitation, or recommendation with respect to products and services provided by the Companies operating under the FXOpen brand, nor is it to be considered financial advice.
Latest from Forex Analysis
Latest articles

Is There the Best Time to Trade Stock CFDs?
If you ask experienced traders, many will say that they trade on certain days or at certain times of the day. Their choice is determined by the market dynamics, volatility, and liquidity. It’s crucial to understand when the best

UnitedHealth (UNH) Share Price Surges after Strong Report
UnitedHealth shares surged Tuesday, rising more than 5% after the health care giant delivered stronger-than-expected first-quarter 2024 results:
→ earnings per share: actual = USD 6.91, expected = USD 6.61, last quarter = USD 6.16;
→ gross income: actual = USD 94.4

USD/JPY Analysis: Prospect of a Breakout of the Level of 155 Yen per Dollar
The USD/JPY rate has consistently reached new highs since 1990, approaching the psychological level of 155 yen per US dollar. The Japanese currency has already fallen about 9% against the dollar this year.
This is supported by Jerome Powell,