


FXOpen

GBP/USD failed to test 1.4000 and started a fresh decline. EUR/GBP is showing positive signs and it is trading nicely above the 0.8675 support zone.
Important Takeaways for GBP/USD and EUR/GBP
- The British Pound topped near the 1.3975 zone and started a fresh decline.
- There was a break below a key contracting triangle with support near 1.3885 on the hourly chart of GBP/USD.
- EUR/GBP started a fresh increase and it settled above the 0.8650 pivot level.
- There was a break above a major bearish trend line with resistance near 0.8695 on the hourly chart.
GBP/USD Technical Analysis
After a steady increase above the 1.3900 level, the British Pound faced sellers against the US Dollar. The GBP/USD pair failed to test the 1.4000 resistance zone and started a fresh decline.
A high was formed at 1.3976 on FXOpen before the pair declined. It broke the 1.3920 and 1.3900 support levels. There was also a break below a key contracting triangle with support near 1.3885 on the hourly chart of GBP/USD.
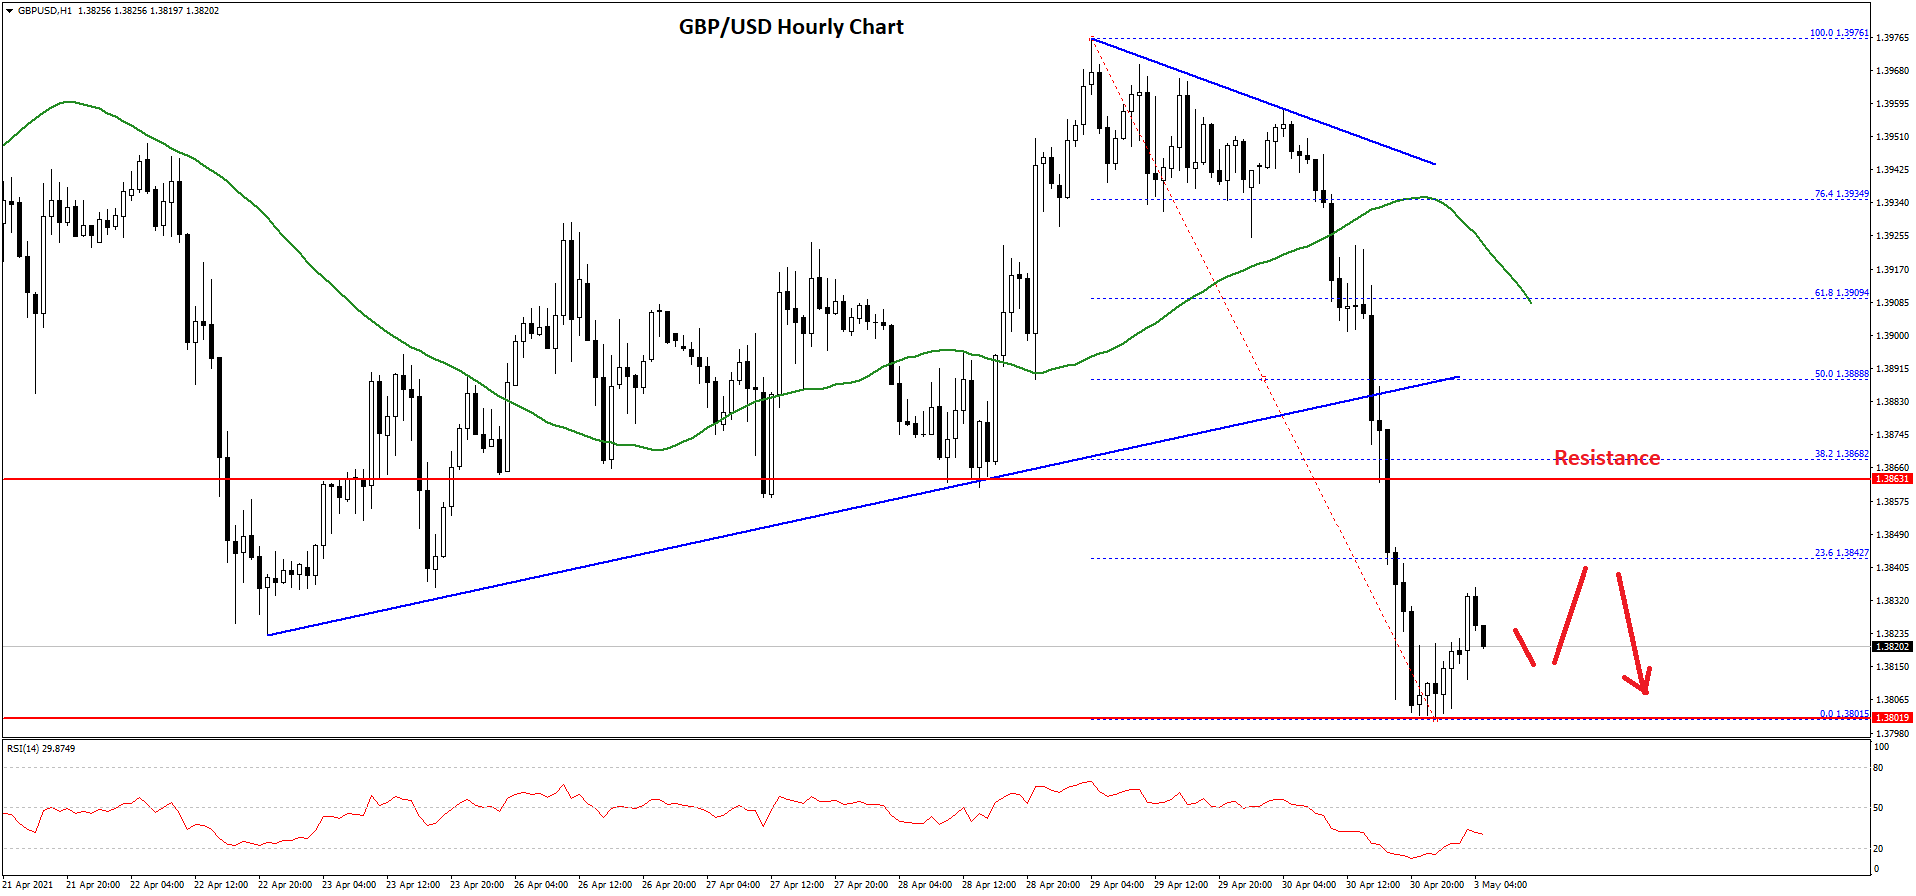
The pair settled well below the 1.3850 level and the 50 hourly simple moving average. It traded as low as 1.3801 and it is now attempting an upside correction.
An initial resistance on the upside is near the 1.3840 level. It is near the 23.6% Fib retracement level of the downward move from the 1.3976 high to 1.3801 low. The first major resistance is near the 1.3860 level.
The next major resistance is near the 1.3885 level. The 50% Fib retracement level of the downward move from the 1.3976 high to 1.3801 low is also near 1.3885. A successful close above 1.3850 and a follow up move above 1.3885 could open the doors for a move towards the 1.4000 resistance.
Conversely, there is a risk of a fresh decline towards the 1.3800 support level. The next major support is near the 1.3780 level. Any more losses could initiate a drop towards the 1.3720 support zone.
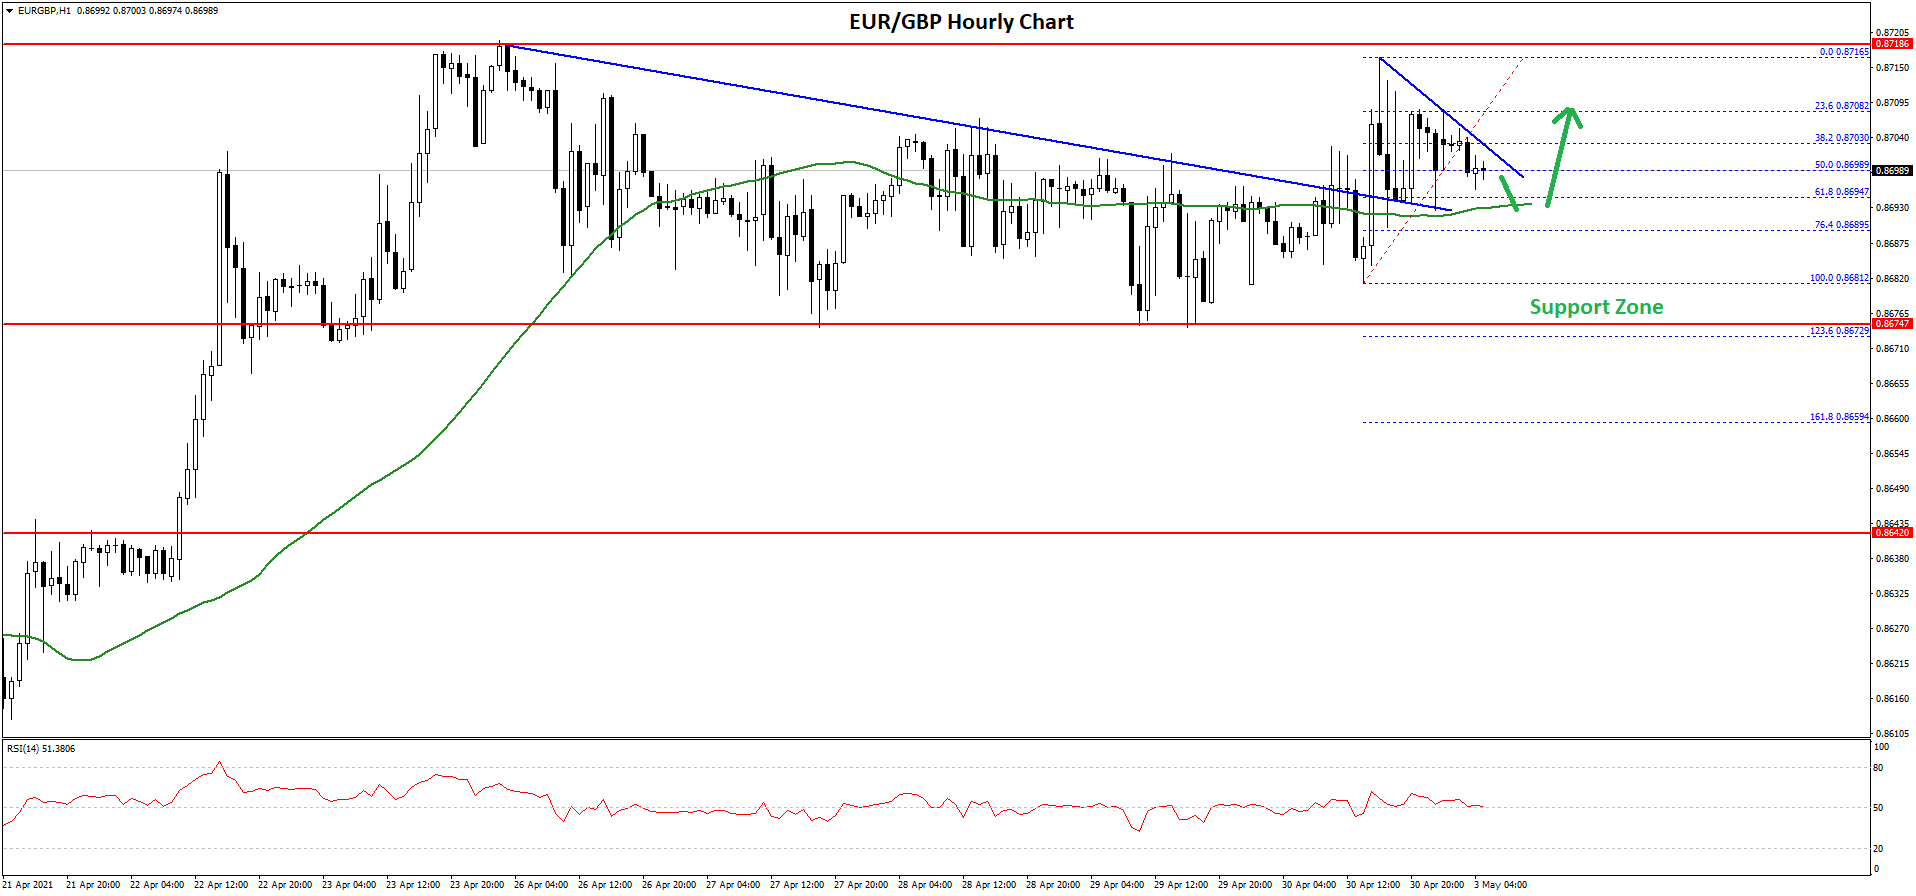
EUR/GBP Technical Analysis
The Euro formed a support base above the 0.8600 level against the British Pound. The EUR/GBP pair climbed higher and broke many hurdles near the 0.8650 level.
The pair even gained pace above the 0.8680 level and the 50 hourly simple moving average. However, it struggled to clear the 0.8720 level and it corrected lower. There was a break below 0.8700, but the bulls were active near 0.8675.
 gbp
gbp
The pair formed a fresh base above 0.8675 and it is now showing signs of upside continuation. There was a break above a major bearish trend line with resistance near 0.8695 on the hourly chart.
The pair is now consolidating near the 50% Fib retracement level of the recent wave from the 0.8681 low to 0.8716 high. An immediate support is near the 0.8695 level and the 50 hourly simple moving average.
The 61.8% Fib retracement level of the recent wave from the 0.8681 low to 0.8716 high is also near the 0.8695 level. Any more losses could set the pace for a drop towards the 0.8675 support.
On the upside, the 0.8720 level is a major resistance. If there is an upside break above 0.8720, the pair could start a fresh rally. In the stated case, there are chances of a move towards the 0.8750 level.
This forecast represents FXOpen Markets Limited opinion only, it should not be construed as an offer, invitation or recommendation in respect to FXOpen Markets Limited products and services or as financial advice.
Trade over 50 forex markets 24 hours a day with FXOpen. Take advantage of low commissions, deep liquidity, and spreads from 0.0 pips. Open your FXOpen account now or learn more about trading forex with FXOpen.
This article represents the opinion of the Companies operating under the FXOpen brand only. It is not to be construed as an offer, solicitation, or recommendation with respect to products and services provided by the Companies operating under the FXOpen brand, nor is it to be considered financial advice.
Latest from Forex Analysis
Latest articles

What Order Imbalance Is and How To Use It in a Trading Strategy
Understanding the nuances of order imbalances is key for traders looking to navigate the ebb and flow of asset prices. Order imbalances provide a clear window into the supply and demand dynamics at play, offering strategic insights. This article delves

XAU/USD Gold Price Reaches an Important Resistance Zone
The XAU/USD gold chart today indicates that the historical record price of the metal is above USD 2,400 per ounce.
In addition to fears of a new round of inflation due to rising commodity prices, geopolitical tensions are

What Is a Break of Structure and How Can You Trade It?
In the ever-evolving world of Smart Money Concept (SMC) trading, a nuanced understanding of market dynamics is indispensable. This article explores the concept of Break of Structure (BOS), how to identify it, and its implications for trading strategies, setting traders