


FXOpen
GBP/USD gained bullish momentum and broke a major resistance near 1.3200. NZD/USD is currently trading near a key resistance at 0.6770, and it could break higher in the near term.
Important Takeaways for GBP/USD and NZD/USD
- The British Pound is placed in a bullish zone above the 1.3200 support.
- GBP/USD broke a key bearish trend line with resistance at 1.3195 on the hourly chart.
- NZD/USD formed a base at 0.6725 and is currently preparing for an upside break.
- China’s GDP in Q2 2018 grew 1.8% (QoQ), better than the market expectation of +1.6%.
GBP/USD Technical Analysis
The British Pound tested the 1.3100 support area this past week against the US Dollar, where buyers emerged. The GBP/USD pair started a solid upward move and broke the 1.3180 and 1.3200 resistance levels.
During the upside move, the pair also broke the 50% Fib retracement level of the last drop from the 1.3284 high to 1.3102 low. More importantly, there was a break above a key bearish trend line with resistance at 1.3195 on the same chart.
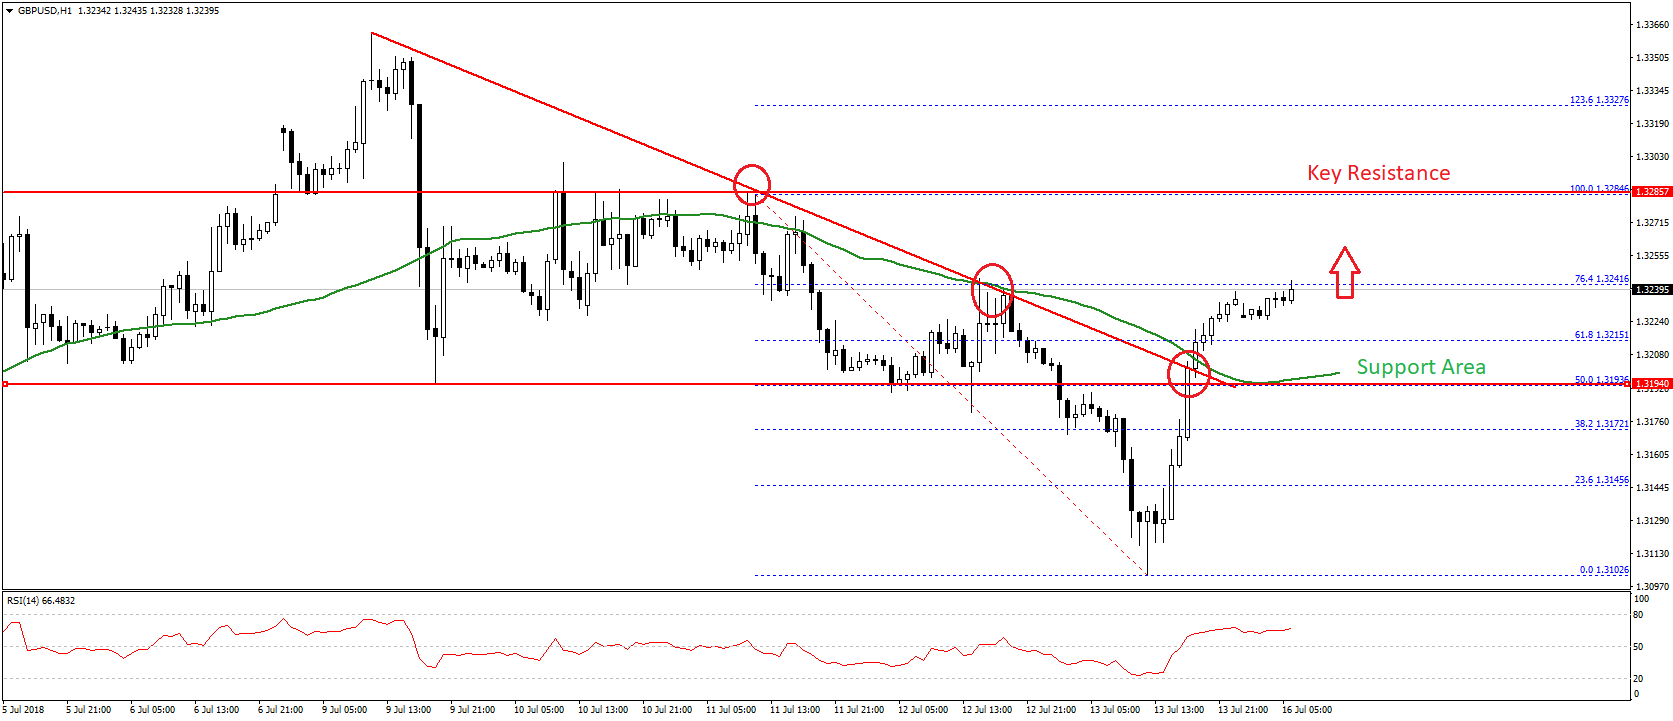
The pair moved into a bullish zone above 1.3200 and settled above the 50 hourly simple moving average. It is currently testing the 76.4% Fib retracement level of the last drop from the 1.3284 high to 1.3102 low at 1.3240.
It could correct a few pips in the near term, but dips remain supported near the 1.3220 and 1.3200 levels. The previous resistance near 1.3195-1.3200 and the 50 hourly SMA are likely to act as strong barriers for sellers.
On the upside, a push above the 1.3240 and 1.3250 resistance levels may perhaps drift the pair towards the last swing high at 1.3284. Above this, the pair is likely to test the 1.236 Fib extension level of the last drop from the 1.3284 high to 1.3102 low at 1.3327.
Overall, the current price action indicates more gains in GBP/USD as long as the pair is above the 1.3200 pivot level.
NZD/USD Technical Analysis
The New Zealand Dollar was under a lot of pressure this past week as it declined below the 0.6750 support against the US Dollar. The NZD/USD pair traded as low as 0.6725 before starting an upward correction.
The pair moved higher and broke the 23.6% Fib retracement level of the last decline from the 0.6857 high to 0.6725 low. More importantly, it moved back above the 0.6750 level and is currently trading above the 50 hourly simple moving average.
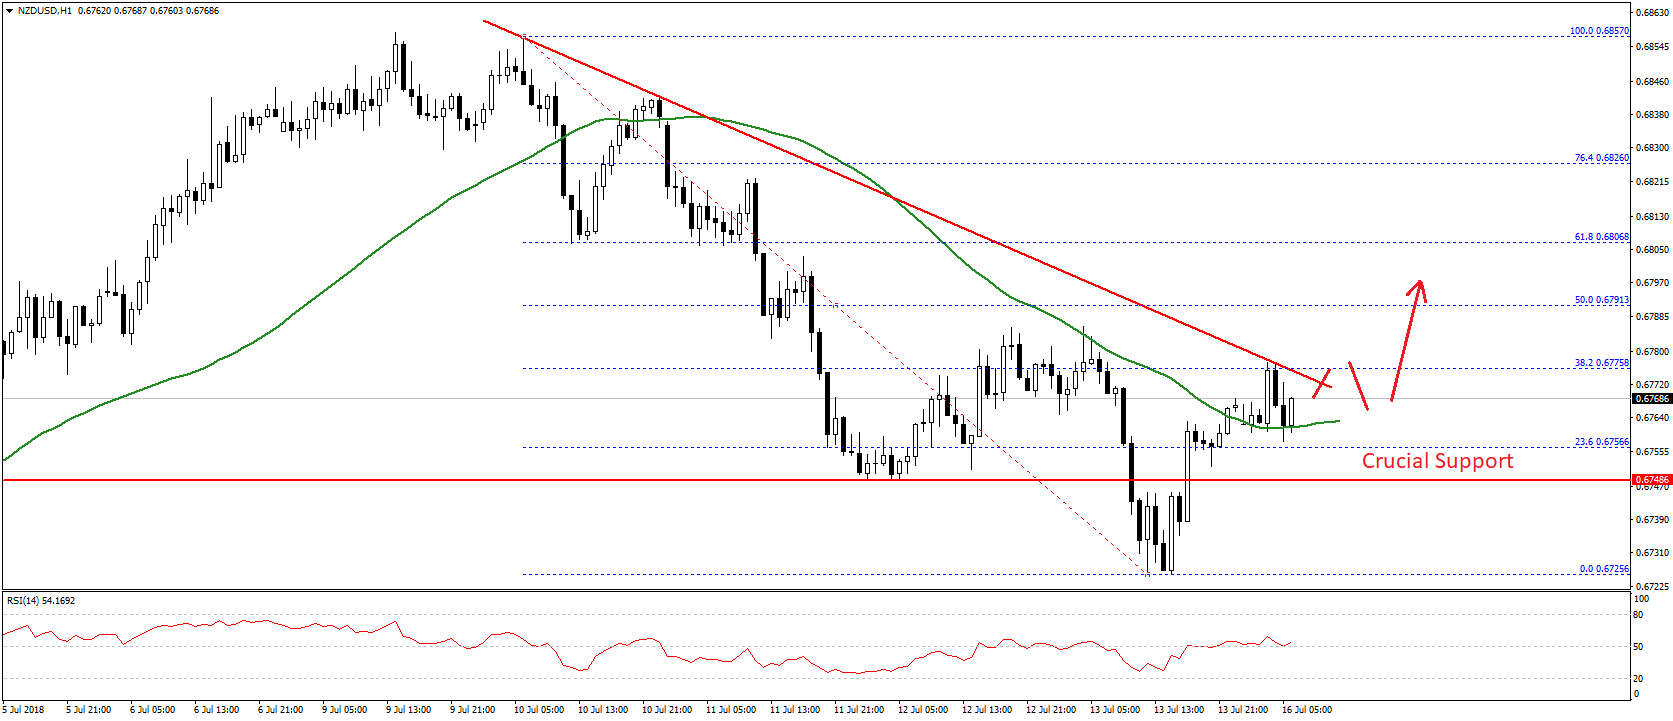
At the outset, the pair is currently attempting to break a key bearish trend line with resistance at 0.6770 on the hourly chart. Should there be a break above 0.6770-0.6775, there could be more gains in NZD/USD.
The next resistance sits near the 50% Fib retracement level of the last decline from the 0.6857 high to 0.6725 low at 0.6791. Above this, the pair may perhaps break the 0.6800 resistance to trade towards 0.6820.
On the flip side, if the pair fails to move above the trend line resistance, it could retest the 0.6750 support. Further below this, the pair will most likely resume its downtrend towards 0.6700.
Trade over 50 forex markets 24 hours a day with FXOpen. Take advantage of low commissions, deep liquidity, and spreads from 0.0 pips. Open your FXOpen account now or learn more about trading forex with FXOpen.
This article represents the opinion of the Companies operating under the FXOpen brand only. It is not to be construed as an offer, solicitation, or recommendation with respect to products and services provided by the Companies operating under the FXOpen brand, nor is it to be considered financial advice.
Latest from Forex Analysis
Latest articles

Google Share Price Rose Post-market to a New All-time Record
Yesterday, after the close of the main trading session, a report on activities for the 1st quarter of Alphabet Inc. (Google's parent company) was published. The report was strong, exceeding investors' expectations.
→ Quarterly EPS = USD 1.89 (expected = USD 1.

S&P 500 Rebounds after Negative GDP News
Data released yesterday showed US GDP growth slowed to 1.6% in the first quarter of the year. According to ForexFactory: forecast = 2.2%, past value = 2.4%.
Reaction to the news sent the S&P 500 mini stock

GBP/USD And USD/CAD Daily Chart Outlook
GBP/USD is attempting a recovery wave from 1.2300. USD/CAD is consolidating and might aim for a move above the 1.3760 resistance zone.
Important Takeaways for GBP/USD and USD/CAD Analysis Today
· The British Pound started