


FXOpen
GBP/USD broke many important supports recently and moved into a bearish zone below 1.3300. On the other hand, USD/CAD climbed sharply and is currently poised to extend gains.
Important Takeaways for GBP/USD and USD/CAD
- The British Pound broke the 1.3340, 1.3310 and 1.3300 support levels versus the US Dollar.
- The GBP/USD pair is currently in a bearish zone and recoveries are likely to be capped.
- USD/CAD is surging higher and it remains buy on dips near the 1.3160 level.
- UK’s Rightmove House Price Index in June 2018 increased 0.4% (MoM), less than the last +0.8%.
GBP/USD Technical Analysis
After a decent upside move, the British Pound faced a lot of selling interest near the 1.3440 level against the US Dollar. The GBP/USD pair started a fresh downside move and broke a few key supports above 1.3300 to move into a bearish zone.
During the decline, there was a break below a connecting bullish trend line with support at 1.3340 on the hourly chart. It opened the doors for more declines and the pair broke the 1.3340, 1.3310 and 1.3300 support levels.
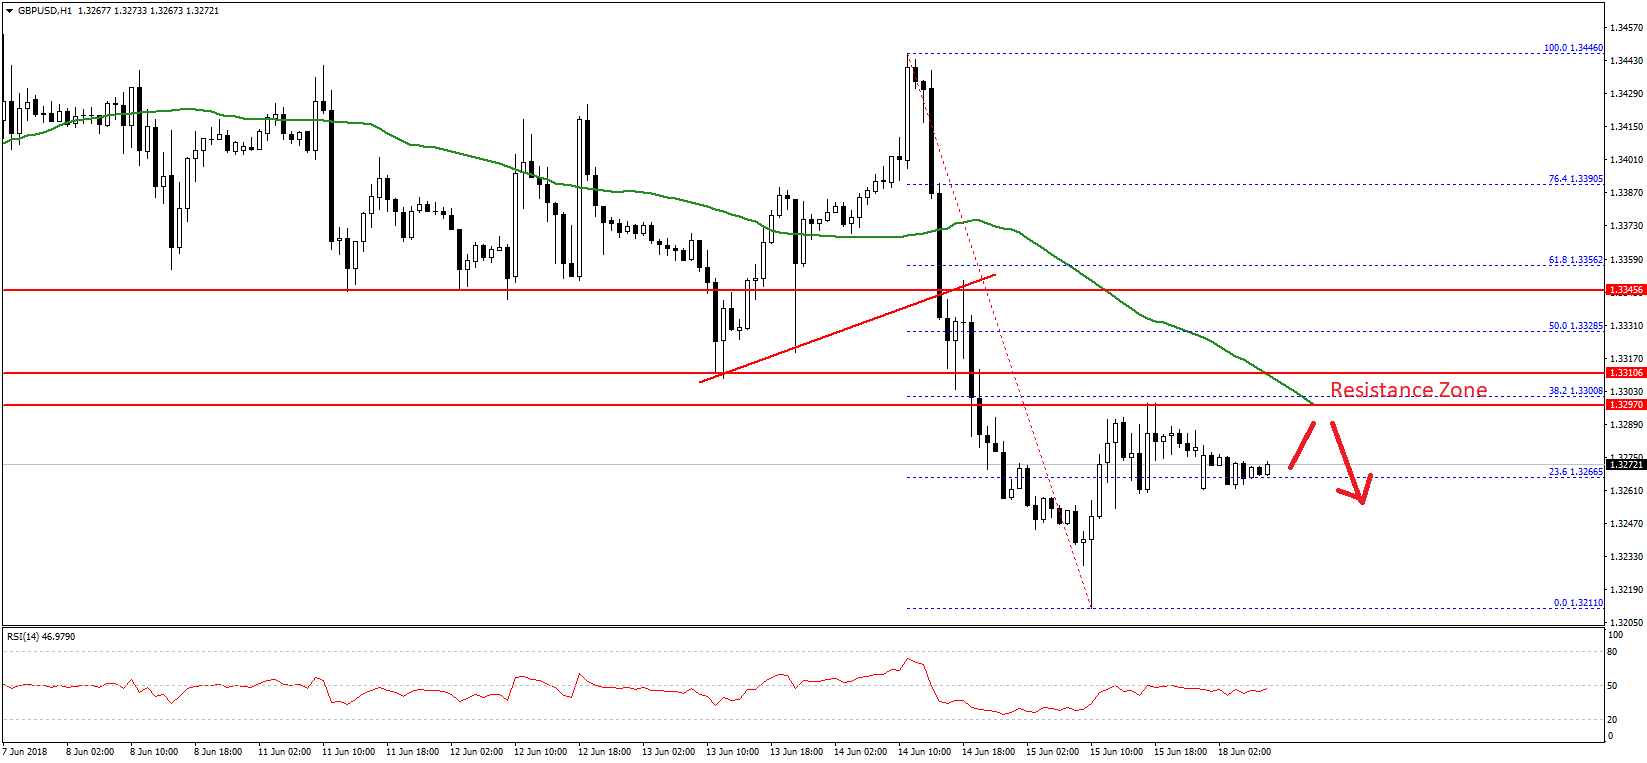
The decline was such that the pair settled below the 1.3300 support and the 50 hourly simple moving average. A low was formed at 1.3211 before the pair recovered. It tested the 38.2% Fib retracement level of the last decline from the 1.3446 high to 1.3211 low.
However, the upside move was protected by the 1.3300 level, which was a support earlier. Above this, the 50% Fib retracement level of the last decline from the 1.3446 high to 1.3211 low at 1.3328 is a major hurdle for buyers.
Therefore, an upside break above 1.3300 and 1.3328 is required for buyers to take control once again. On the flip side, a break below 1.3260 may perhaps push the pair back towards 1.3220.
Recently in the UK, the Rightmove House Price Index for June 2018 was released. The market was looking for a rise of around 0.5% in the index compared with the previous month.
However, the actual result was a bit on the lower side as the Rightmove House Price Index increased 0.4%. In terms of the yearly change, there was a rise of 1.6%, more than the last 1.1%.
USD/CAD Technical Analysis
The US Dollar surged higher after it formed a bottom around the 1.2960 level against the Canadian Dollar. The USD/CAD pair climbed higher and broke the 1.3000 and 1.3050 resistance levels to move into a bullish zone.
The pair even traded above the 1.3200 level before carving a short-term top at 1.3207. At the moment, the pair is correcting lower and it already broke the 23.6% Fib retracement level of the last wave from the 1.3120 low to 1.3207 high.
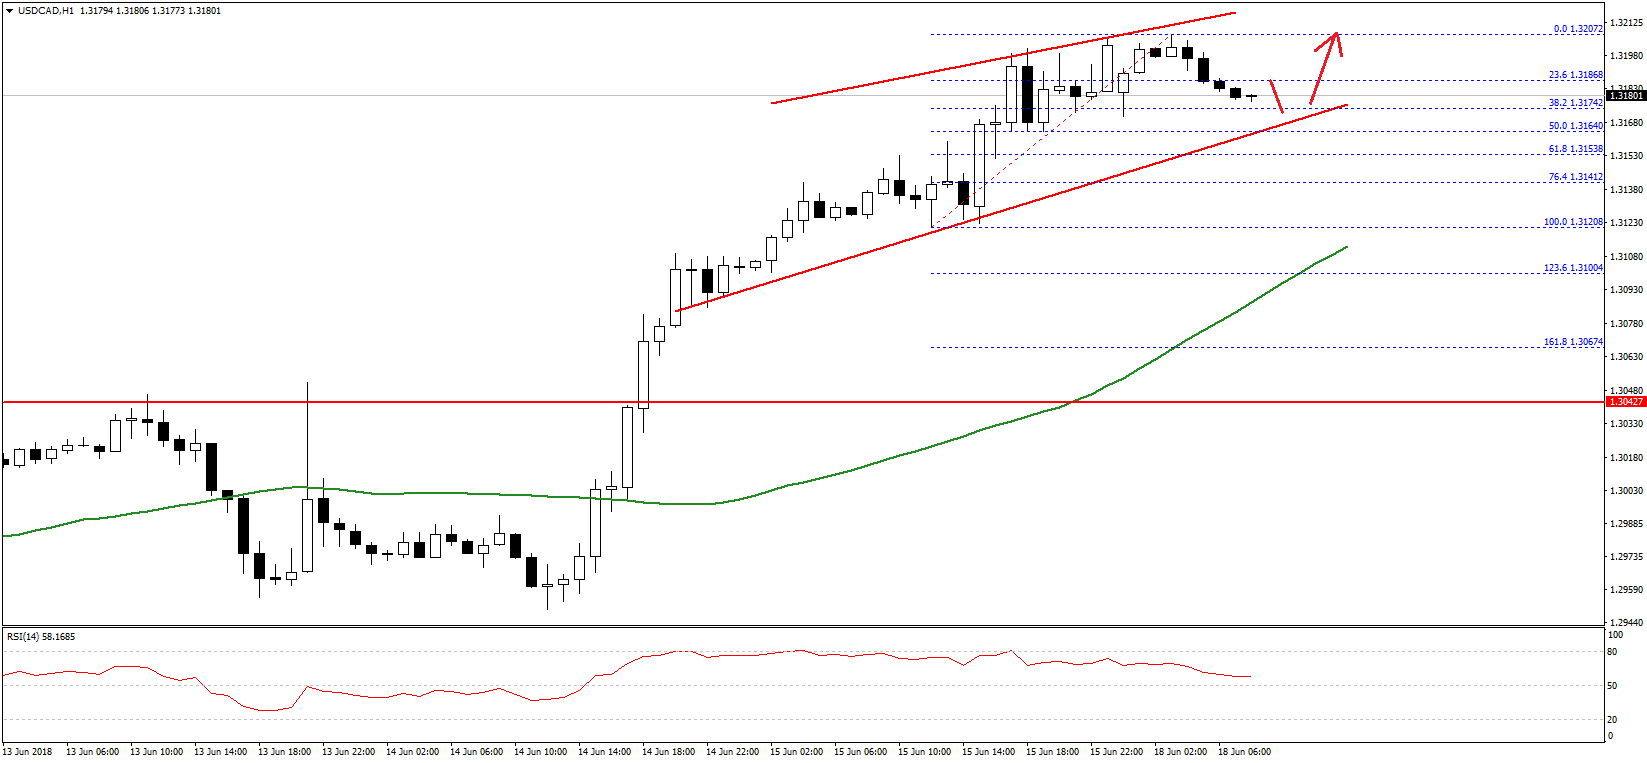
However, there is a major bullish trend line in place with support at 1.3165/60 on the hourly chart of USD/CAD. Therefore, if the pair continues to move down, it is likely to find bids above 1.3160.
Below 1.3160, the next major support is at 1.3120 and the 50 hourly SMA. On the upside, resistances are at 1.3200, 1.3210 and 1.3240.
Trade over 50 forex markets 24 hours a day with FXOpen. Take advantage of low commissions, deep liquidity, and spreads from 0.0 pips. Open your FXOpen account now or learn more about trading forex with FXOpen.
This article represents the opinion of the Companies operating under the FXOpen brand only. It is not to be construed as an offer, solicitation, or recommendation with respect to products and services provided by the Companies operating under the FXOpen brand, nor is it to be considered financial advice.
Latest from Forex Analysis
Latest articles

Market Analysis: AUD/USD and NZD/USD Turn Red
AUD/USD declined below the 0.6500 and 0.6455 support levels. NZD/USD is also moving lower and might struggle to recover above 0.5950.
Important Takeaways for AUD/USD and NZD/USD Analysis Today
· The Aussie Dollar started

Since the Start of the Week, Brent Oil Price Has Dropped over 4%
At the beginning of the week, March 15, we wrote that the price of Brent oil could form a correction from the resistance level of USD 91 per barrel. Since then, the price has decreased by more than 4% due

Fair Value Gaps vs Liquidity Voids in Trading
Understanding fair value gaps and liquidity voids is essential for traders seeking to navigate the complexities of the financial markets. These concepts, deeply rooted in the Smart Money Concept (SMC), provide valuable insights into the dynamics of supply and demand,