


FXOpen
GBP/USD found a strong support near 1.3100 and bounced back sharply. On the other hand, USD/JPY broke a key support at 109.85 and is currently trading in a bearish zone.
Important Takeaways for GBP/USD and USD/JPY
- The British Pound traded higher and broke the 1.3200 resistance zone against the US Dollar.
- The GBP/USD pair broke a connecting bearish trend line at 1.3230 on the hourly chart.
- USD/JPY declined recently and broke the 110.00 and 109.85 support levels.
- The pair may perhaps extend the current decline towards the 109.25 level.
GBP/USD Technical Analysis
The British Pound found support near the 1.3100 level after a major decline against the US Dollar. The GBP/USD pair started an upward wave and moved above the 1.3150 and 1.3200 resistance levels.
The upward wave was strong as the pair closed above the 1.3200 resistance and the 50 hourly simple moving average. There was also a break above a connecting bearish trend line at 1.3230 on the hourly chart.
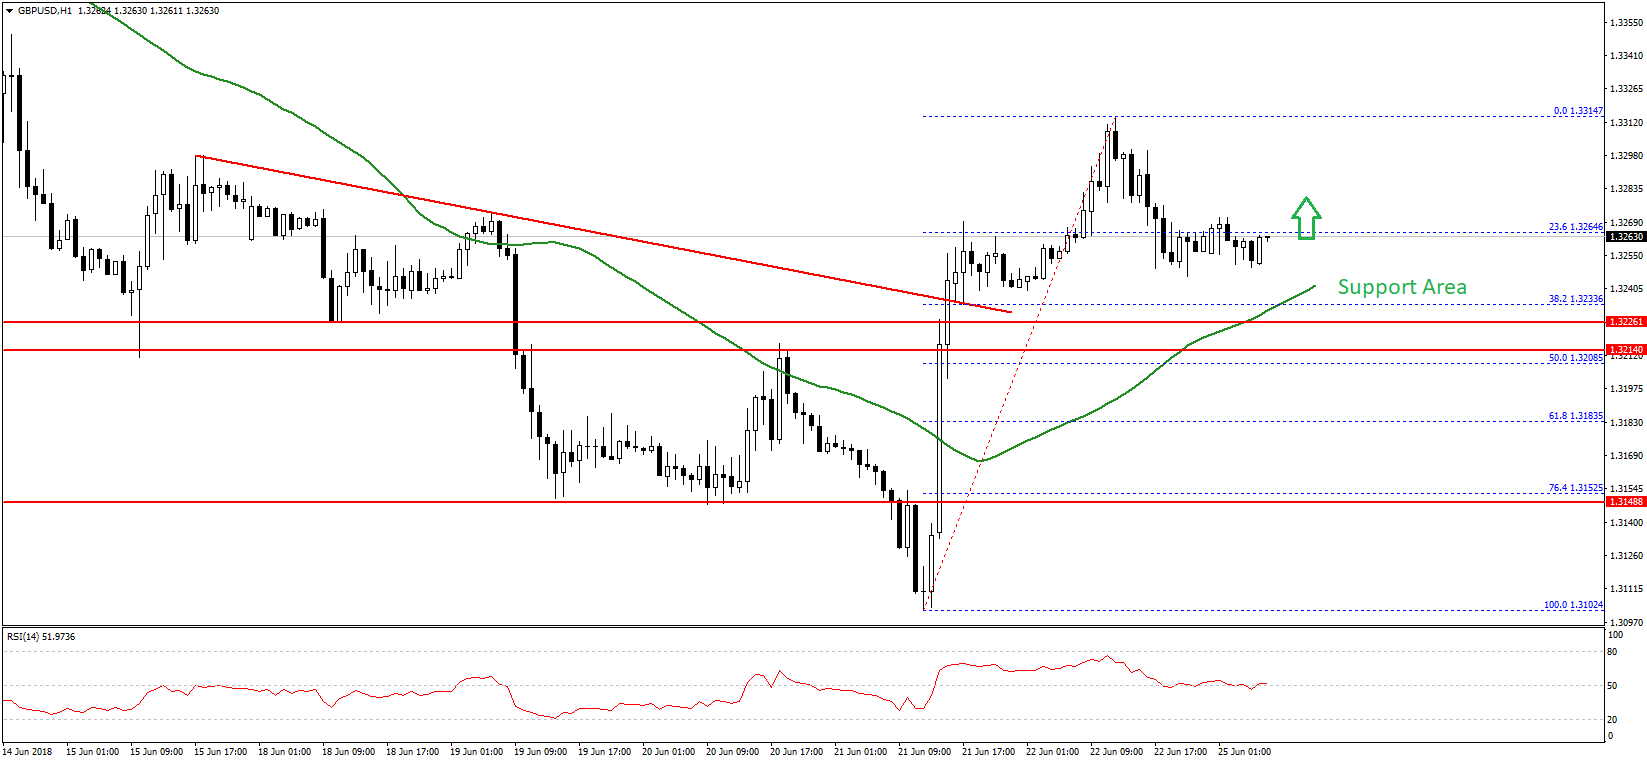
During the recent ride, the pair even broke the 1.3300 level and traded as high as 1.3314 before starting a downside correction. It traded below the 23.6% Fib retracement level of the last wave from the 1.3102 low to 1.3314 high.
However, there are many supports around the 1.3200 level and the 50 hourly SMA. An initial support is around the 38.2% Fib retracement level of the last wave from the 1.3102 low to 1.3314 high at 1.3233. The most important support is at 1.3200, which was as a resistance earlier.
On the upside, the pair is facing resistances near 1.3290 and 1.3300. Above 1.3300, the pair will most likely trade towards the 1.3340 level in the near term.
USD/JPY Technical Analysis
The US Dollar traded above the 110.50 level recently against the Japanese Yen. The USD/JPY pair tested the 110.75 level where sellers protected further upsides. As a result, there was a downside reaction and the pair declined below the 110.00 support.
More importantly, there was a break below the 109.885 support zone and the 50 hourly simple moving average. At the moment, the pair is trading near the last swing low of 109.50.
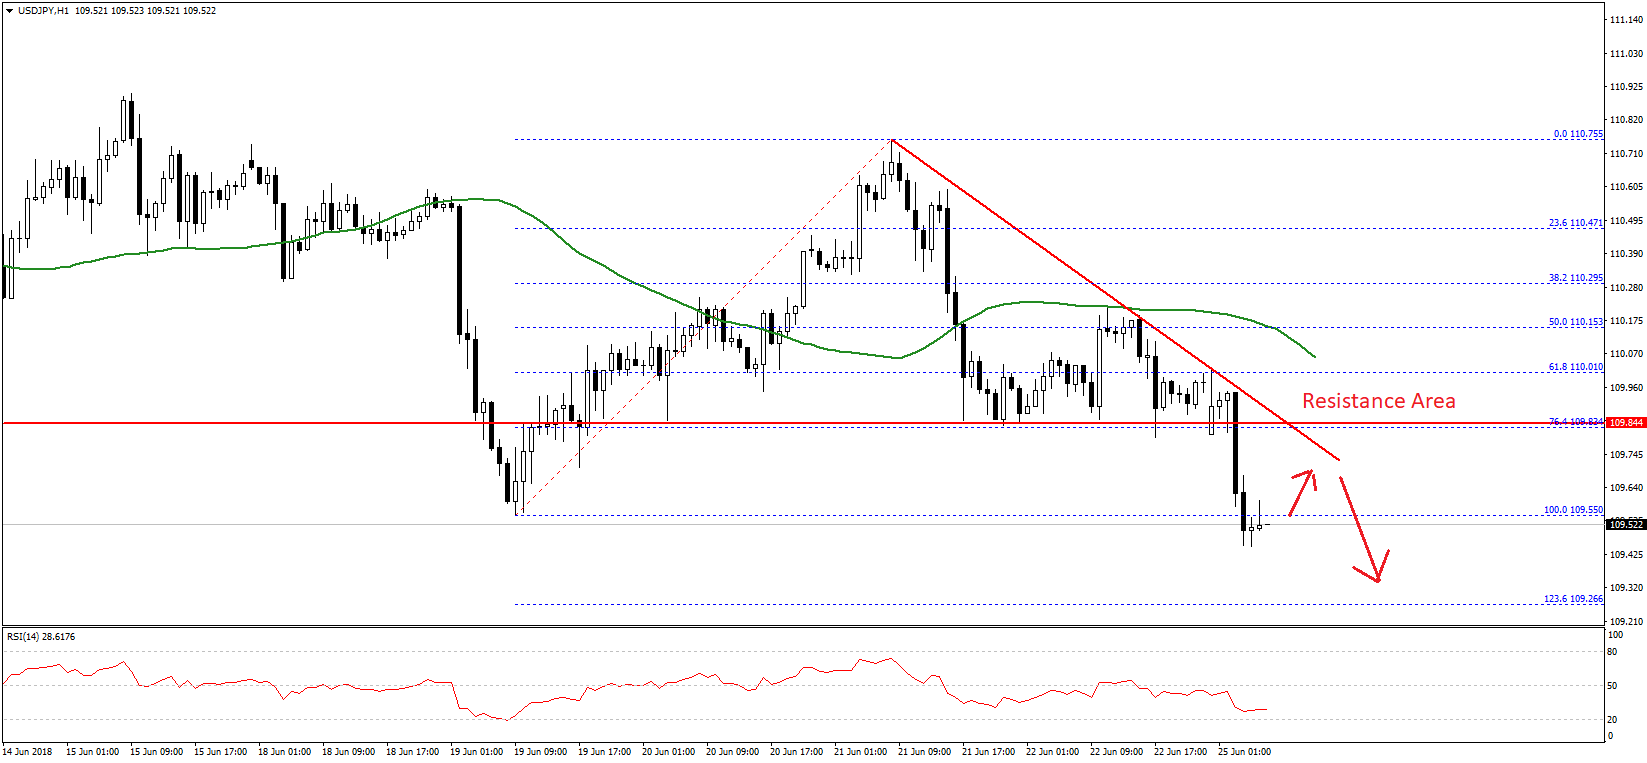
Should there be more declines, the pair could test the 1.236 Fib extension level of the last wave from the 109.55 low to 110.75 high at 109.26. Below this, the pair may perhaps extend its decline towards the 109.00 and 108.80 support levels.
On the flip side, if the pair corrects higher, the previous support at 109.85 will most likely protect gains. There is also a key bearish trend line in place with resistance at 109.80 on the hourly chart.
Only a successful close above the 109.80, 109.85 and 110.00 resistance levels could start a fresh upward wave in USD/JPY. If not, the pair may well continue to trade lower towards 109.25 and 109.00.
Today in the US, the number of New Home Sales will be reported for May 2018 by the US Census Bureau. The market is looking for a rise in the number of New Home Sales by around 3.3% compared with the previous month.
If the result is positive and sales rise by more than 3%, the US Dollar may attempt a recovery. On the other hand, if the actual reading misses the forecast, there could be more losses in USD/JPY.
Trade over 50 forex markets 24 hours a day with FXOpen. Take advantage of low commissions, deep liquidity, and spreads from 0.0 pips. Open your FXOpen account now or learn more about trading forex with FXOpen.
This article represents the opinion of the Companies operating under the FXOpen brand only. It is not to be construed as an offer, solicitation, or recommendation with respect to products and services provided by the Companies operating under the FXOpen brand, nor is it to be considered financial advice.
Latest from Forex Analysis
Latest articles

AUD/USD Rises Sharply on Inflation News
The Consumer Price Index for Australia was released this morning. According to ForexFactory:
→ CPI in quarterly terms: actual = 1.0%, expected = 0.8%, previous value = 0.6%;
→ CPI in annual terms: actual = 3.5%, expected = 3.4%, previous value = 3.

TSLA Share Price Up About 13% Despite Disappointing Report
Yesterday, TSLA trading closed at USD 144.68 per share, after which Tesla reported its results for the 1st quarter:
→ earnings per share: actual = USD 0.45, forecast = USD 0.49;
→ gross income: actual = USD 21.45 billion, forecast = USD

Market Analysis: Gold Price Corrects Gains While Oil Price Regains Strength
Gold price rallied above $2,400 before correcting lower. Crude oil price is rising and it could climb further higher toward the $85.50 resistance.
Important Takeaways for Gold and Oil Prices Analysis Today
· Gold price rallied significantly above $2,