


FXOpen
Gold price corrected lower recently and found support near the $1,286 level. Crude oil price is following a bullish path and it may continue to rise in the short term towards $55.00.
Important Takeaways for Gold and Oil
- Gold price found support near the $1,286 level and recently recovered above $1,290 against the US Dollar.
- There is a major bullish trend line in place with support at $1,282 on the hourly chart of gold.
- Crude oil price climbed higher recently and broke the $48.00 and $50.00 resistances.
- There are two bullish trend lines formed with support near $52.20 on the hourly chart of XTI/USD.
Gold Price Technical Analysis
Gold price traded higher recently and broke the $1,295 resistance zone against the US Dollar. The price traded close to the $1,300 level before sellers appeared near the $1,297 and $1,298 resistance levels.
A high was formed near $1,297 on FXOpen and later the price declined below $1,295. Sellers pushed the price below the 50% Fib retracement level of the last leg from the $1,280 low to $1,297 high. However, the decline found a strong support near the $1,286 level.
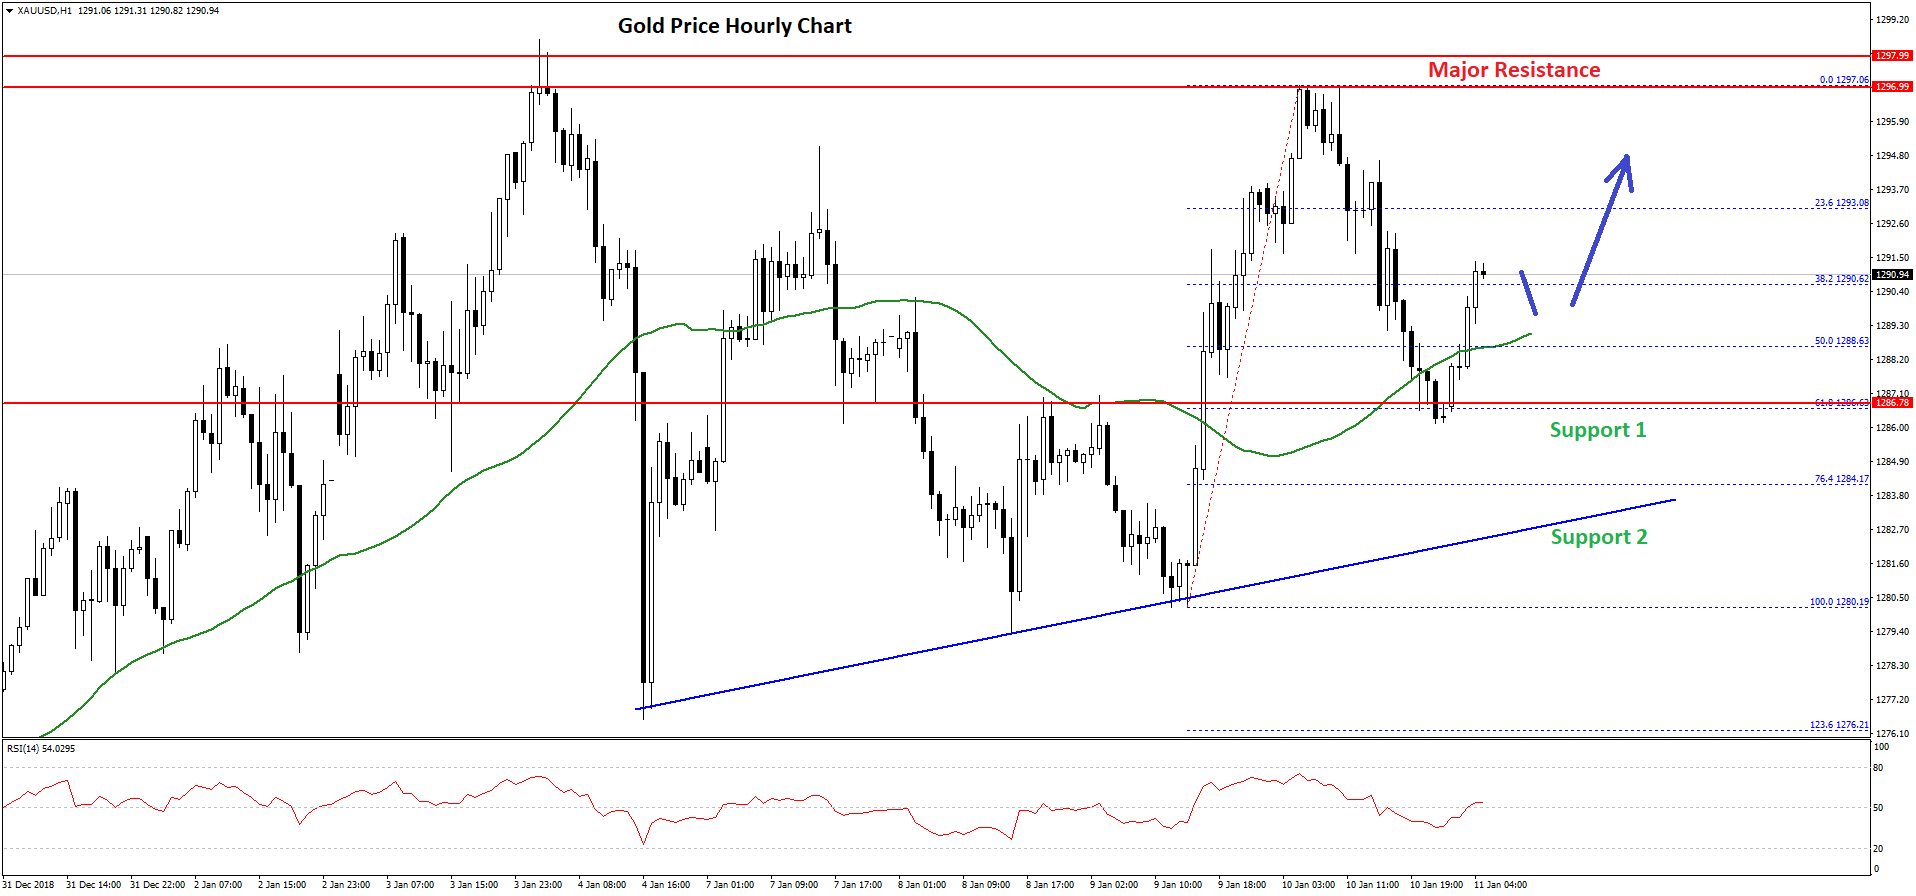
Besides, the 61.8% Fib retracement level of the last leg from the $1,280 low to $1,297 high also acted as a support. The price bounced back above $1,290 and the 50 hourly simple moving average.
The current price action is positive and it seems like there could be more gains above the $1,292 and $1,295 resistance levels. However, a proper break above the $1,298 resistance is needed for more gains in the near term.
On the downside, an initial support is at $1,290, followed $1,288. Moreover, there is a major bullish trend line in place with support at $1,282 on the hourly chart of gold. Overall, dips remain supported in gold and the price may soon trade towards $1,298.
Oil Price Technical Analysis
Crude oil price started a solid recovery from the $48.00 support zone against the US Dollar. The price traded above the $50.00 and $51.50 resistance levels to move into a bullish zone.
The recent upward move was positive since there was a close above the $52.00 level and the 50 hourly simple moving average. The price even broke the $52.60 resistance and traded as high as $52.99.
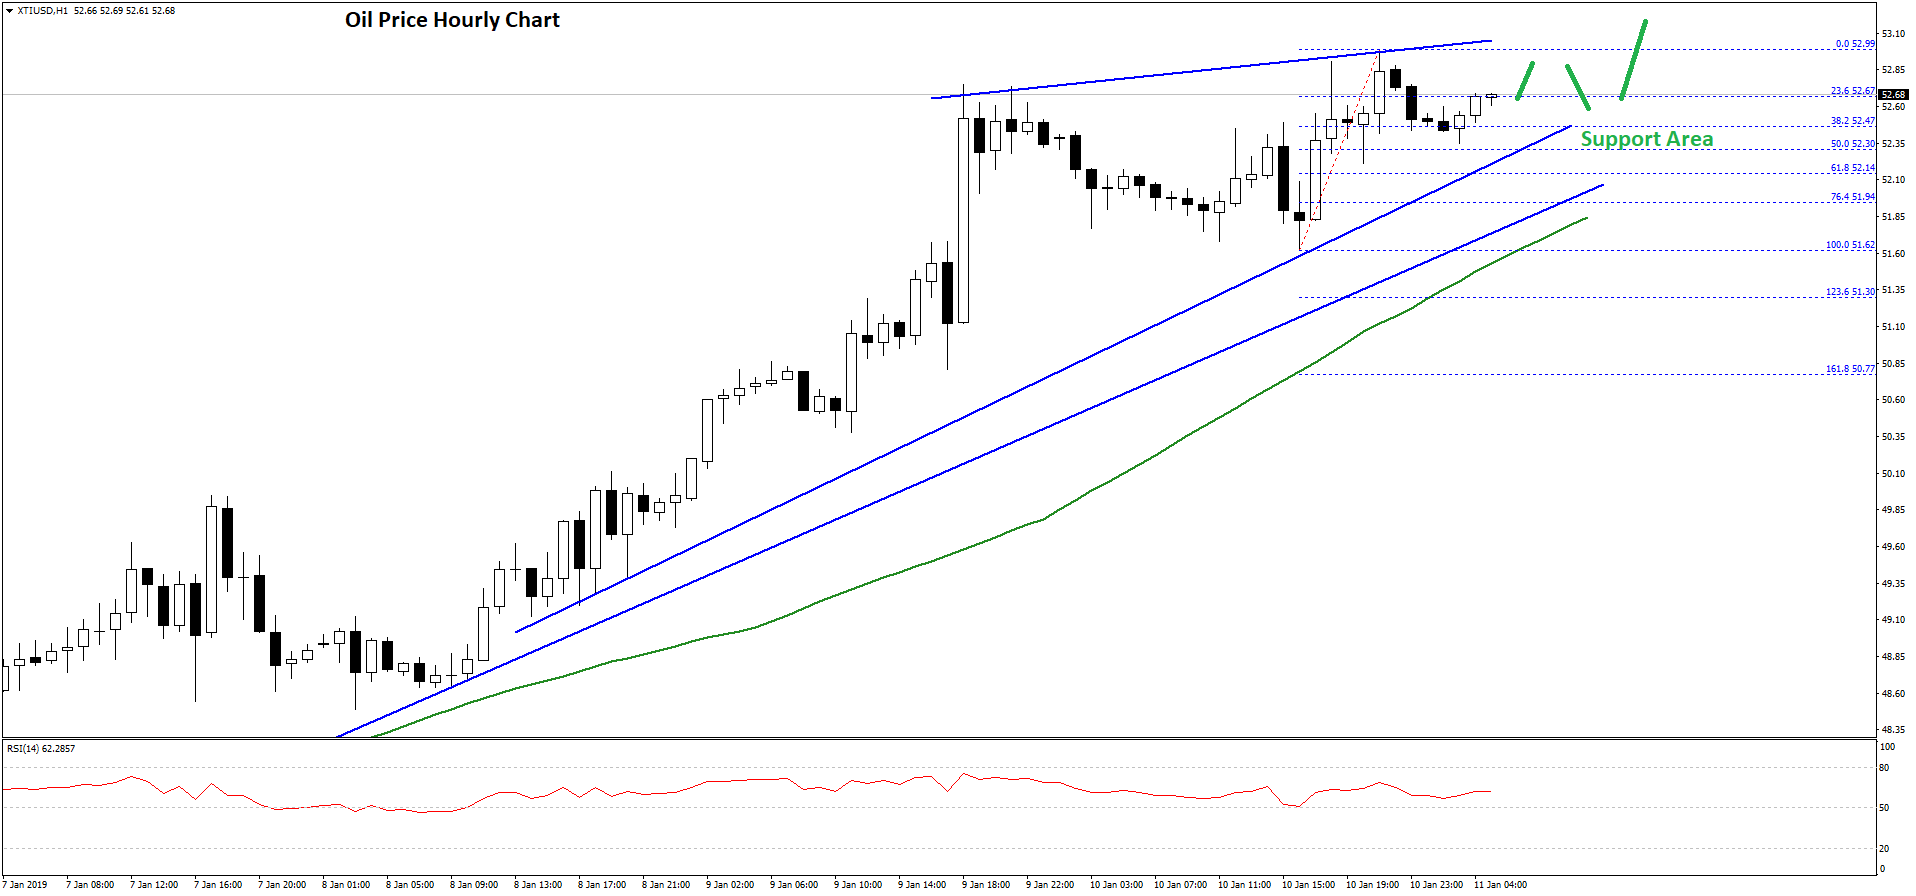
The price is currently correcting lower below $52.60 and the 23.6% Fib retracement level of the recent wave from the $51.62 low to $52.99 high. However, there are many supports on the downside near the $52.40 and $52.30 levels.
There are also two bullish trend lines formed with support near $52.20 on the hourly chart of XTI/USD. The trend lines are positioned near the 50% Fib retracement level of the recent wave from the $51.62 low to $52.99 high.
Therefore, dips in the short term remain well supported above the $52.20 level. If there is a downside break below $52.20 and $52.00, the price may decline towards the $50.00 support.
On the upside, a break above the $53.00 resistance could clear the path for more gains towards the $54.20 and $54.50 levels in the near term.
Trade over 50 forex markets 24 hours a day with FXOpen. Take advantage of low commissions, deep liquidity, and spreads from 0.0 pips. Open your FXOpen account now or learn more about trading forex with FXOpen.
This article represents the opinion of the Companies operating under the FXOpen brand only. It is not to be construed as an offer, solicitation, or recommendation with respect to products and services provided by the Companies operating under the FXOpen brand, nor is it to be considered financial advice.
Latest from Forex Analysis
Latest articles

AUD/USD Rises Sharply on Inflation News
The Consumer Price Index for Australia was released this morning. According to ForexFactory:
→ CPI in quarterly terms: actual = 1.0%, expected = 0.8%, previous value = 0.6%;
→ CPI in annual terms: actual = 3.5%, expected = 3.4%, previous value = 3.

TSLA Share Price Up About 13% Despite Disappointing Report
Yesterday, TSLA trading closed at USD 144.68 per share, after which Tesla reported its results for the 1st quarter:
→ earnings per share: actual = USD 0.45, forecast = USD 0.49;
→ gross income: actual = USD 21.45 billion, forecast = USD

Market Analysis: Gold Price Corrects Gains While Oil Price Regains Strength
Gold price rallied above $2,400 before correcting lower. Crude oil price is rising and it could climb further higher toward the $85.50 resistance.
Important Takeaways for Gold and Oil Prices Analysis Today
· Gold price rallied significantly above $2,