


FXOpen
Gold price corrected higher, but it failed to gain momentum above $1,255. Crude oil price started a new downside correction and it could decline towards the $71.00 support.
Important Takeaways for Gold and Oil
- Gold price found support around the $1,245 level and recovered against the US Dollar.
- There was a break above a major bearish trend line with resistance at $1,251 on the hourly chart of gold.
- Crude oil price formed a short-term top at $73.61 and is currently correcting lower.
- The Caixin China Manufacturing PMI posted a minor decline from 51.1 to 51.0 in June 2018.
Gold Price Technical Analysis
Gold price was under a lot of pressure recently as it declined below the $1,260 support level against the US Dollar. The price traded as low as $1,246 before forming a support for an upward correction.
It recovered nicely above the $1,250 resistance and the 50% Fib retracement level of the last decline from the $1,259 high to $1,246 low. More importantly, there was a break above a major bearish trend line with resistance at $1,251 on the hourly chart of gold.
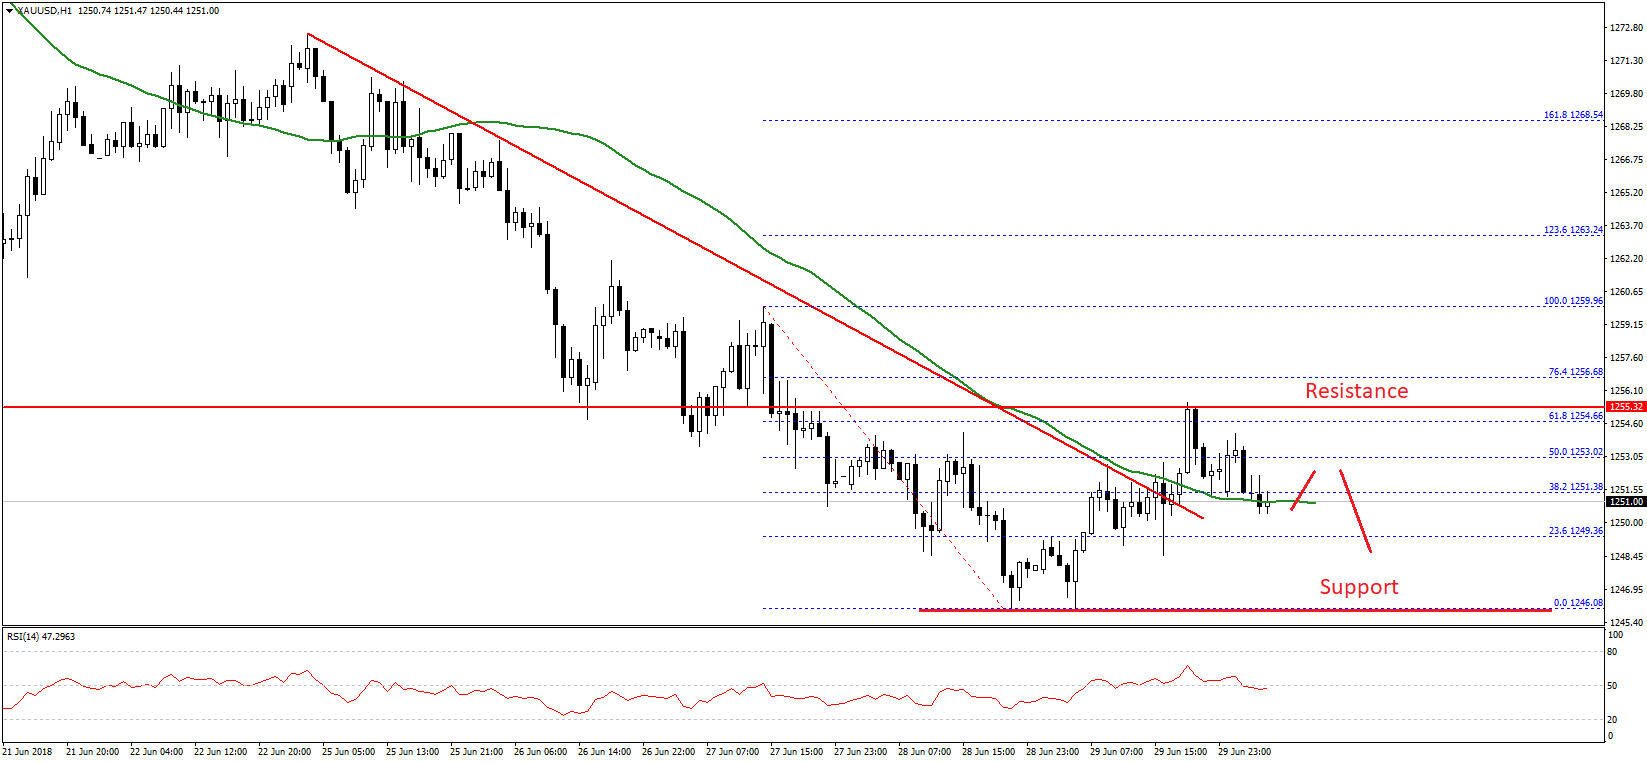
The price traded towards the $1,255 level where it faced sellers. Moreover, the price failed to break the 61.8% Fib retracement level of the last decline from the $1,259 high to $1,246 low.
A fresh downside wave was initiated and the price declined back below $1,252. At the moment, the price is trading near the $1,250 support and the 50 hourly simple moving average.
Should there be more declines below $1,250, the price may perhaps revisit the $1,246 low. On the flip side, if the price recovers, then it must clear the $1,255 resistance. Above this last, the next stop for buyers could be near the last high of $1,259.
Oil Price Technical Analysis
Crude oil price was in a major uptrend from the $64.50 swing low against the US Dollar. The price traded higher, broke many resistances levels such as $68.00 and $70.00, and settled above the 50 hourly simple moving average.
It even traded above the $72.50 resistance and formed a high near $73.61. Later, it faced sellers and is currently correcting lower. During the recent decline, the price broke a crucial ascending channel with support at $72.80 on the hourly chart.
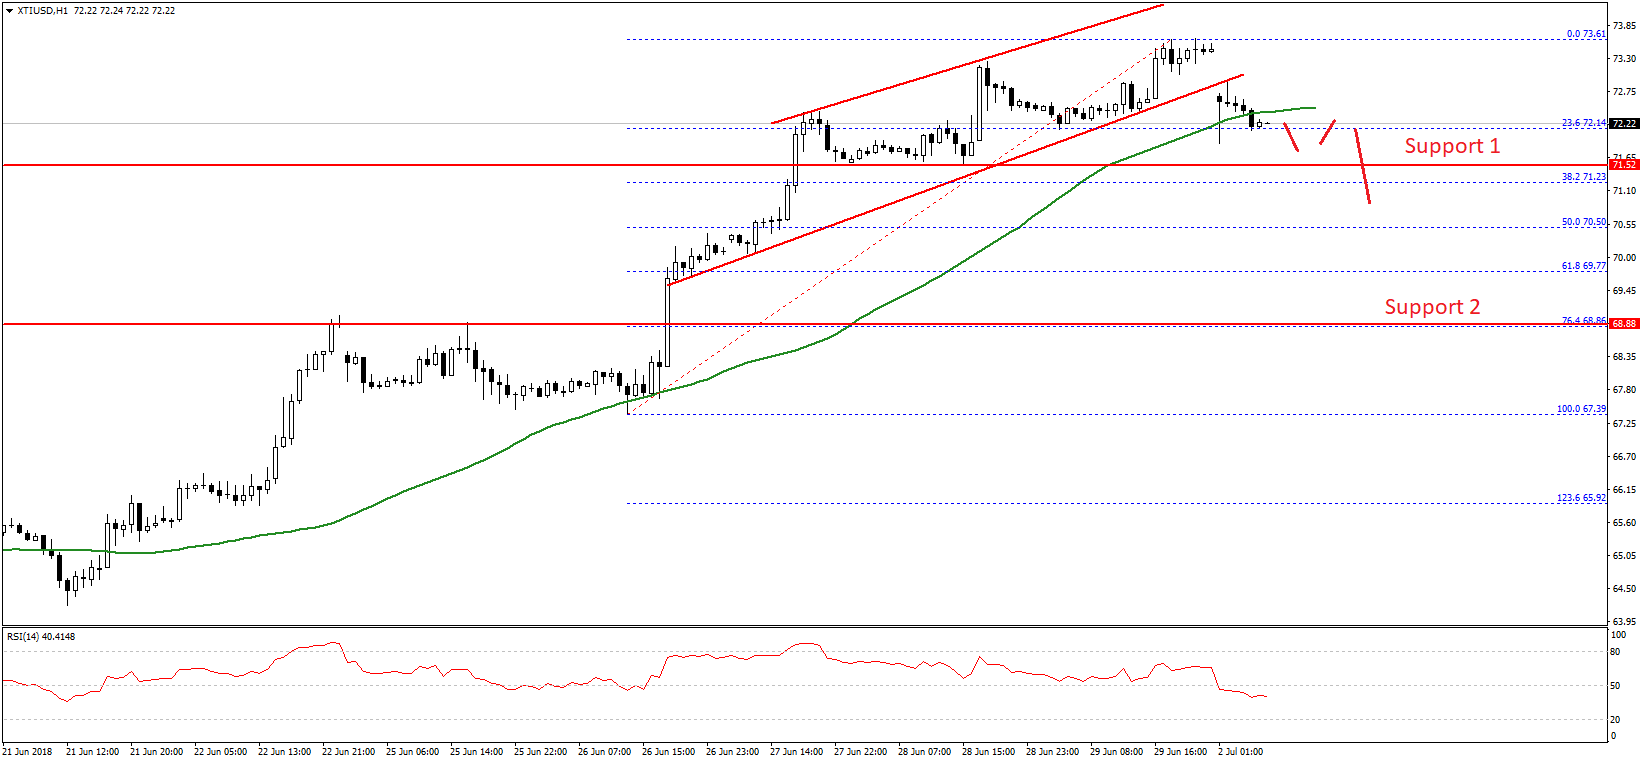
It opened the doors for more declines and the price moved below $72.50 and the 50 hourly SMA. At the moment, the price is testing the 23.6% Fib retracement level of the last wave from the $67.39 low to $73.61 high.
However, it seems like the price may perhaps extend the current decline towards the $71.20-30 support area. Should there be a downside break below $71.20, the price could test the 50% Fib retracement level of the last wave from the $67.39 low to $73.61 high at $70.50.
On the upside, the broken support at $72.70-80 might act as a resistance. Above this, the price will most likely resume its uptrend above the $73.00 level.
Recently in China, the Caixin Manufacturing PMI for June 2018 was released. The market was looking for a minor decline from the last reading of 51.1 to 51.0
The actual result was similar as the PMI came in at 51.0. However, there was no negative impact on gold price as it remained near the $1,250 support.
Trade over 50 forex markets 24 hours a day with FXOpen. Take advantage of low commissions, deep liquidity, and spreads from 0.0 pips. Open your FXOpen account now or learn more about trading forex with FXOpen.
This article represents the opinion of the Companies operating under the FXOpen brand only. It is not to be construed as an offer, solicitation, or recommendation with respect to products and services provided by the Companies operating under the FXOpen brand, nor is it to be considered financial advice.
Latest from Forex Analysis
Latest articles

EUR/USD Dives While USD/CHF Extends Rally
EUR/USD started a fresh decline below the 1.0695 support. USD/CHF is rising and might aim a move toward the 0.9250 resistance.
Important Takeaways for EUR/USD and USD/CHF Analysis Today
· The Euro struggled to clear

The Dollar Is Losing Some of Its Gains While Awaiting a Verdict from the Fed
The American currency continues to trade in different directions relative to leading currencies. Thus, the yen paired with theUS dollar fell in price to a 34-year low, and in pairs with European and commodity currencies we are seeing a corrective

5 Stocks To Consider For May 2024
Time flies, especially when things are running smoothly, and this year so far has been a period free of dramatic events across the capital markets.
Suddenly, we are almost halfway through 2024, and the forthcoming month takes us up to