


FXOpen
Gold price failed to stay above $1,210 and declined below $1,205. Crude oil price remains in an uptrend, but it could correct slightly in the short term.
Important Takeaways for Gold and Oil
- Gold price settled below a key support and pivot level at $1,208 against the US Dollar.
- There is a contracting triangle in place with resistance at $1,204 on the hourly chart of gold.
- Crude oil price gained bullish momentum recently and broke the $68.00 and $70.00 resistances.
- There is a bullish trend line formed with support at $69.90 on the hourly chart of XTI/USD.
Gold Price Technical Analysis
Gold price surged higher after forming a key bottom near $1,184 against the US Dollar. The price climbed above the $1,190, $1,200 and $1,210 resistance levels to move into a bullish zone.
The upside move was strong as the price traded towards the $1,215 level. However, the price failed to hold gains above the $1,210 level and later started a downside move. There was a slow and steady decline and the price broke the $1,210 and $1,208 support levels.
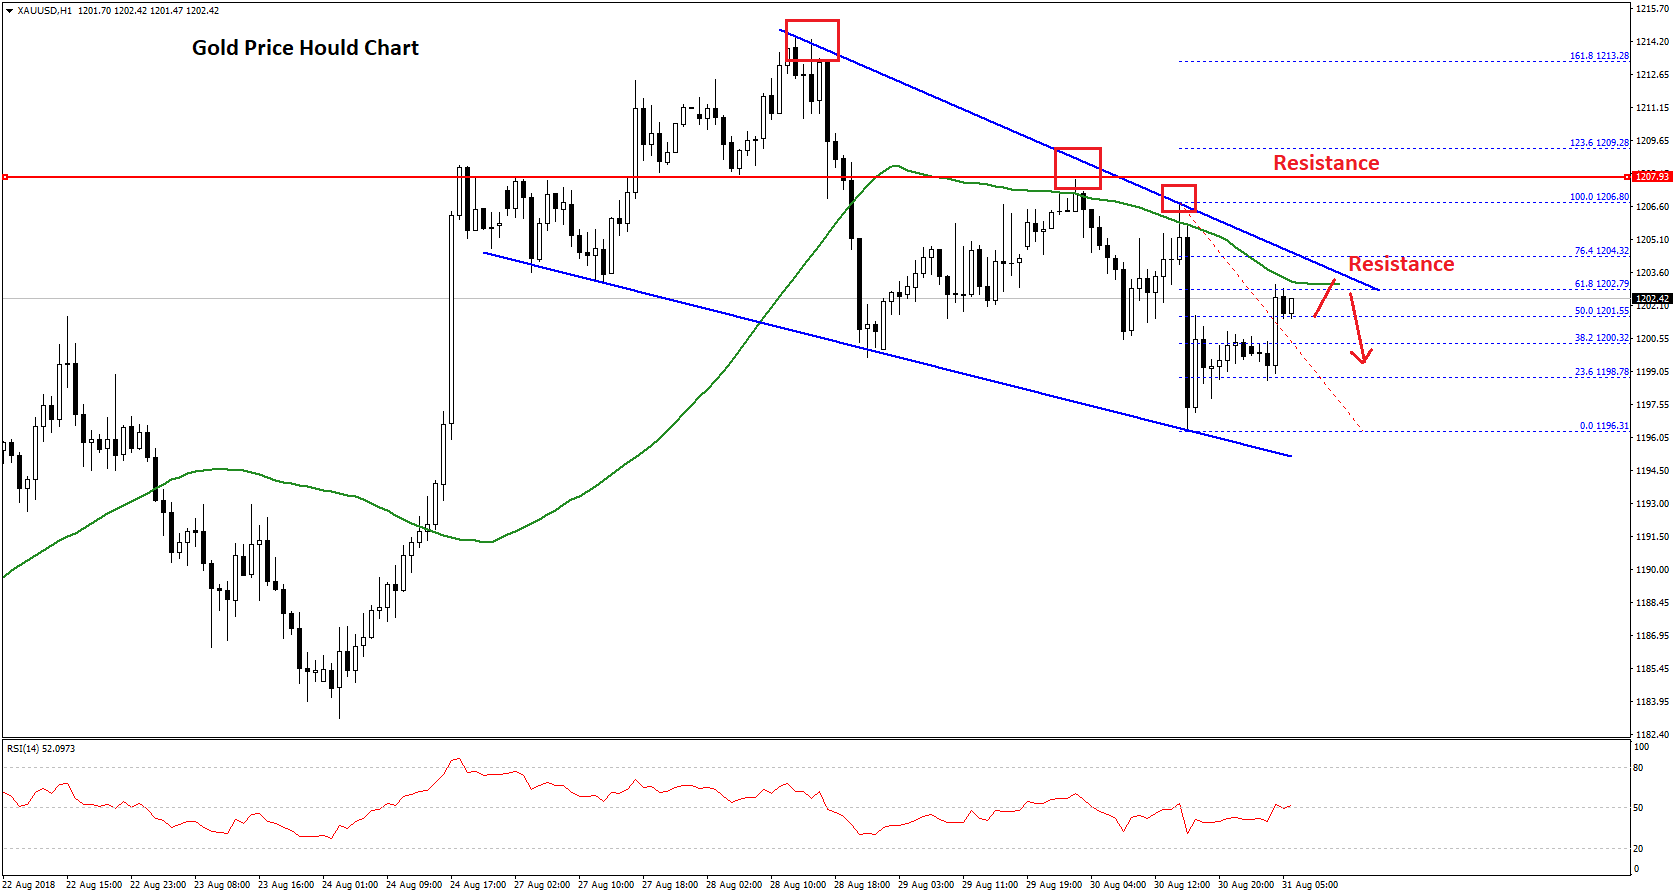
The decline was such that the price even broke the $1,200 support and settled below the 50 hourly simple moving average. It traded as low as $1,196.31 and later corrected higher. It moved above the 50% Fib retracement level of the last decline from the $1,206.80 high to $1,196.31 low.
However, the price is facing resistance near the $1,204 level and the 50 hourly SMA. More importantly, there is a contracting triangle in place with resistance at $1,204 on the hourly chart of gold.
Therefore, the price could fail to break the $1,204-1,205 resistance and decline once again. On the downside, the $1,195 and $1,190 levels may be the next targets for sellers.
On the other hand, if the price breaks the triangle resistance at $1,205 and settles above the 50 hourly SMA, there could be a nice upward move towards the $1,208 pivot level and the $1,210 resistance.
Oil Price Technical Analysis
Crude oil price remained in a crucial uptrend from the $65.00 swing low against the US Dollar. The price climbed higher recently and broke many resistances like $66.00, $68.00 and even $70.00.
The price traded towards the $70.25 level and settled above the 50 hourly simple moving average. A high was formed at $70.26 before the price started a downside correction. It moved down and broke the $70.00 support.
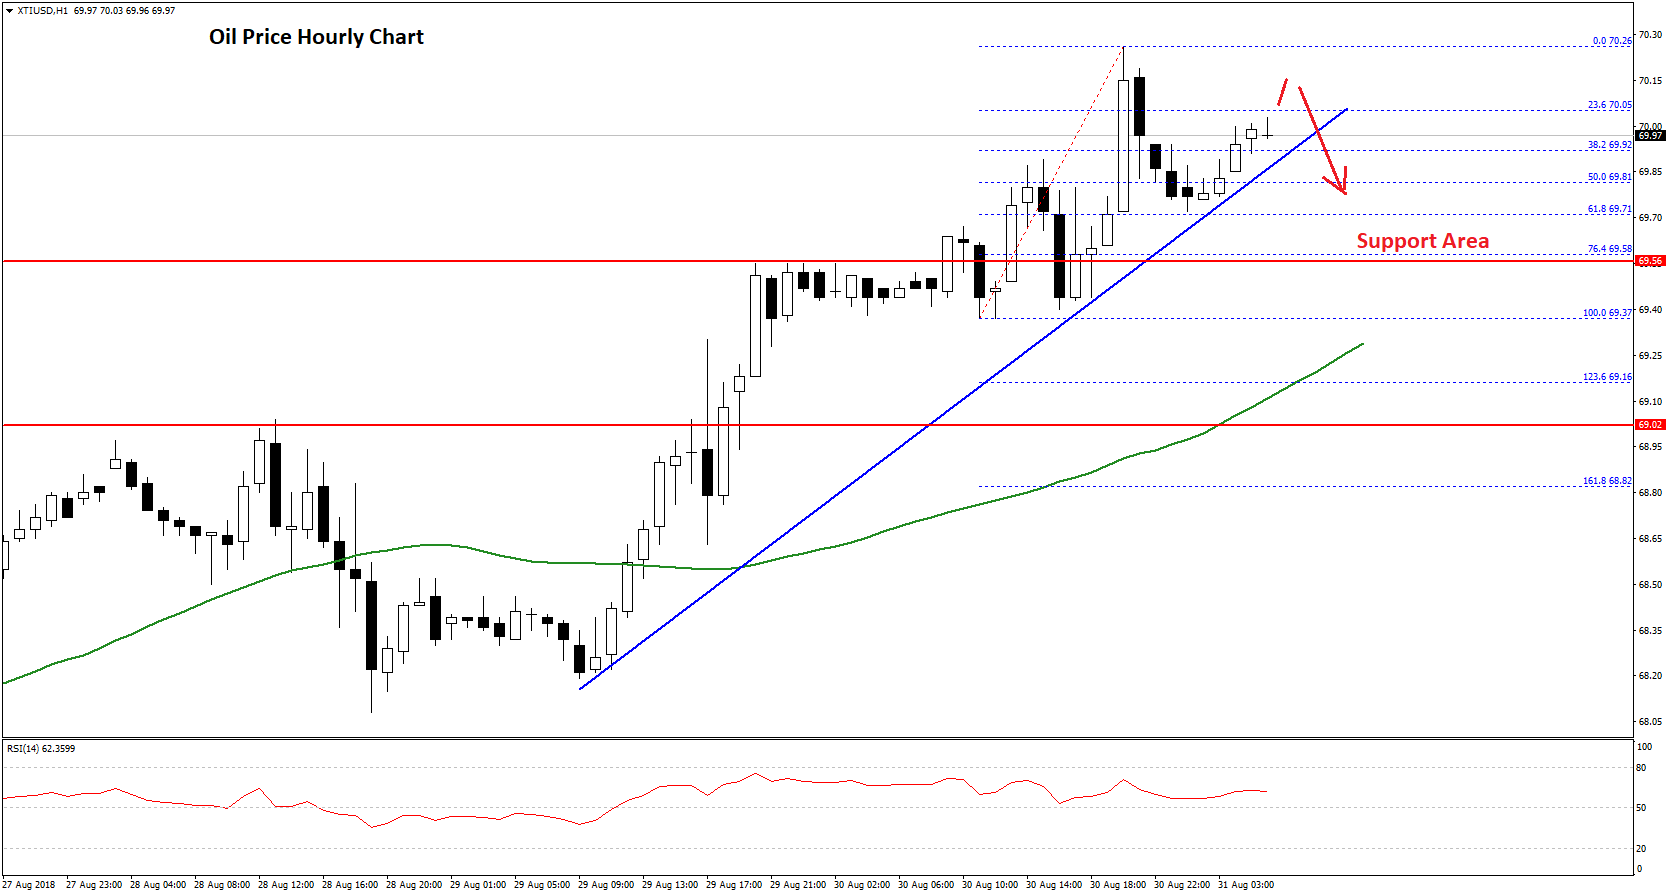
There was also a break below the 50% Fib retracement level of the last wave from the $69.37 low to $70.26 high. However, the decline was protected by the $69.75 support.
The 61.8% Fib retracement level of the last wave from the $69.37 low to $70.26 high also acted as a support. Moreover, there is a bullish trend line formed with support at $69.90 on the hourly chart of XTI/USD.
The price recovered and is currently trading near the $70.00 level. At the outset, it seems like the price is struggling to gain momentum above the $70.00 level. Therefore, there is a possibility of a downside correction below the trend line and the $69.75 level in the near term.
Below $69.75, the next major support is positioned near the $69.50 level, which is also a crucial pivot area. On the other hand, if the price continues to move higher, it could break the $70.25 resistance and test the $70.50 level.
Trade over 50 forex markets 24 hours a day with FXOpen. Take advantage of low commissions, deep liquidity, and spreads from 0.0 pips. Open your FXOpen account now or learn more about trading forex with FXOpen.
This article represents the opinion of the Companies operating under the FXOpen brand only. It is not to be construed as an offer, solicitation, or recommendation with respect to products and services provided by the Companies operating under the FXOpen brand, nor is it to be considered financial advice.
Latest from Forex Analysis
Latest articles

Google Share Price Rose Post-market to a New All-time Record
Yesterday, after the close of the main trading session, a report on activities for the 1st quarter of Alphabet Inc. (Google's parent company) was published. The report was strong, exceeding investors' expectations.
→ Quarterly EPS = USD 1.89 (expected = USD 1.

S&P 500 Rebounds after Negative GDP News
Data released yesterday showed US GDP growth slowed to 1.6% in the first quarter of the year. According to ForexFactory: forecast = 2.2%, past value = 2.4%.
Reaction to the news sent the S&P 500 mini stock

GBP/USD And USD/CAD Daily Chart Outlook
GBP/USD is attempting a recovery wave from 1.2300. USD/CAD is consolidating and might aim for a move above the 1.3760 resistance zone.
Important Takeaways for GBP/USD and USD/CAD Analysis Today
· The British Pound started