


FXOpen

Gold price started a steady rise above the $1,700 and $1,710 levels. Similarly, crude oil price is showing positive signs and it could continue to rise above $28.00.
Important Takeaways for Gold and Oil
- Gold price gained traction and climbed above the $1,722 resistance against the US Dollar.
- There are two key bullish trend lines forming with support near $1,725 and $1,706 on the hourly chart of gold.
- Crude oil price is rising steadily and it could soon test the $30.00 resistance.
- There is a crucial bullish trend line forming with support near $26.00 on the hourly chart of XTI/USD.
Gold Price Technical Analysis
Gold price remained well bid above the $1,680 level and climbed above $1,700 against the US Dollar. There was a clear break above the $1,718 and $1,722 resistance levels to start a decent increase.
The price even settled above the $1,722 level and the 50 hourly simple moving average. It traded to a new weekly high at $1,736 on FXOpen and the price is currently consolidating gains.
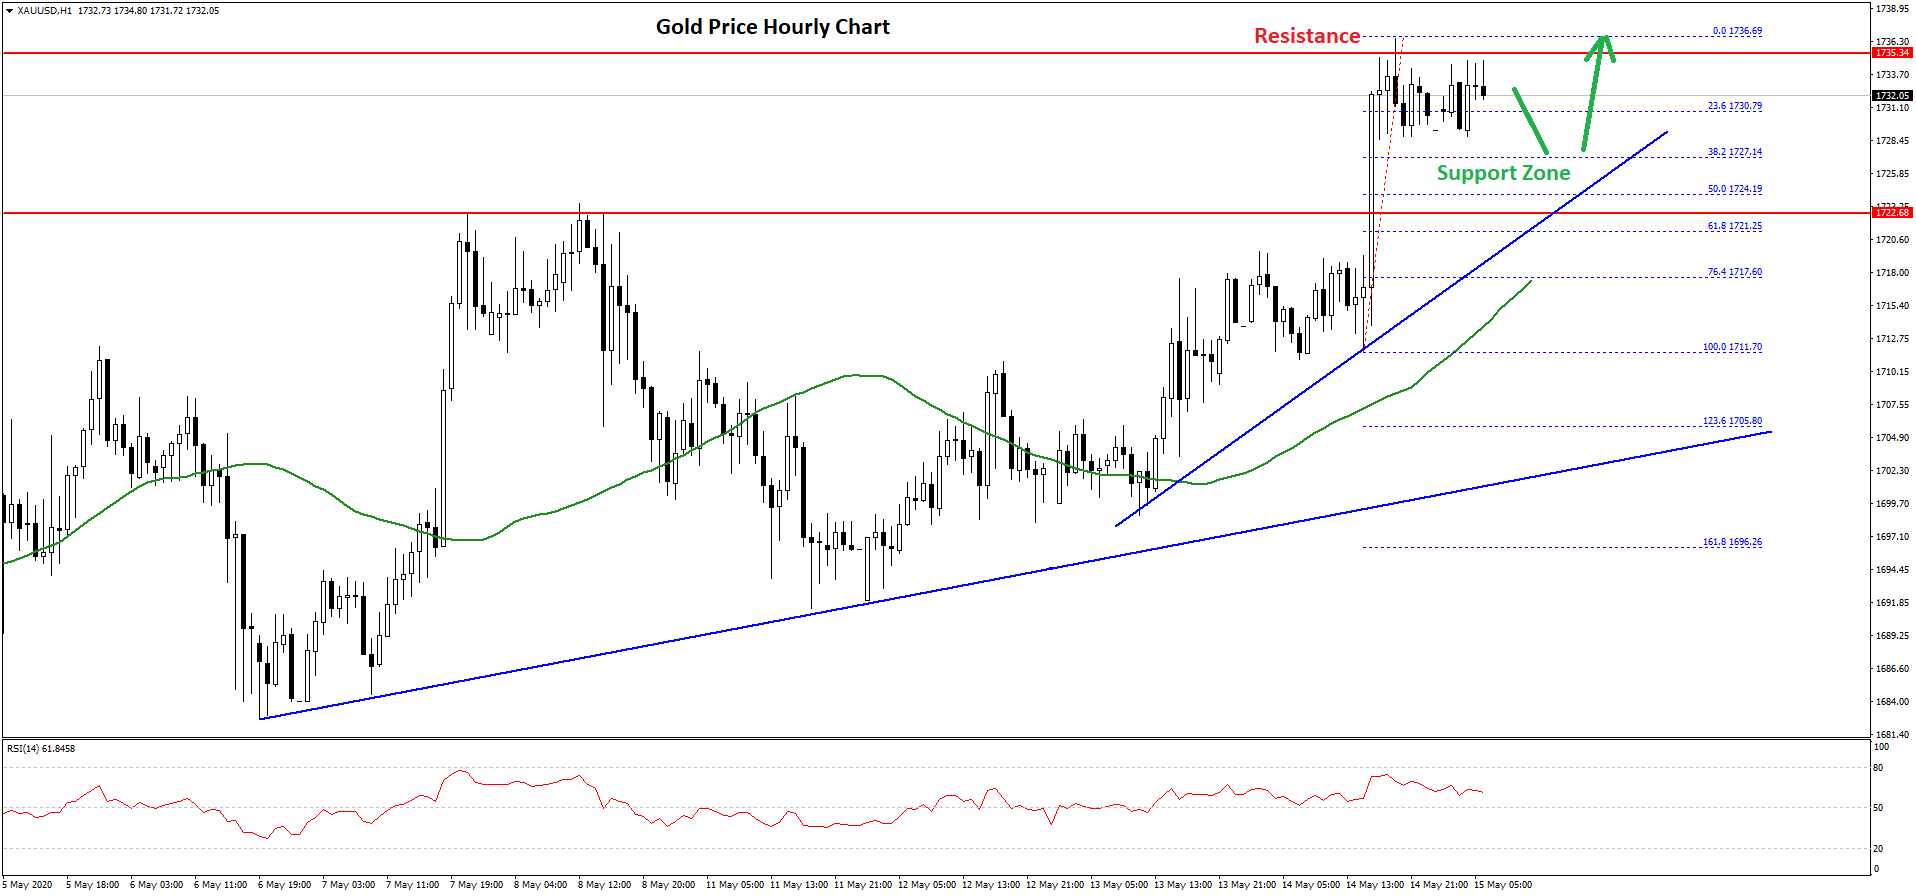
It tested the 23.6% Fib retracement level of the recent rise from the $1,711 low to $1,736 high. On the downside, there are many supports forming near the $1,727 and $1,725 levels.
Moreover, there are two key bullish trend lines forming with support near $1,725 and $1,706 on the hourly chart of gold. The first trend line is close to the 50% Fib retracement level of the recent rise from the $1,711 low to $1,736 high.
If gold price fails to stay above the $1,725 support, it could decline towards the 50 hourly simple moving average or the second trend line at $1,706.
On the upside, an initial resistance is near the $1,735 level. A successful break above the recent high might open the doors for a move towards the $1,750 level in the near term.
Oil Price Technical Analysis
Crude oil price consolidated above the $25.00 support for a few sessions before extending its rise against the US Dollar. The price gained traction and broke the $26.50 and $26.75 resistance levels.
Besides, there was a close above the $27.50 resistance area and the 50 hourly simple moving average. It even climbed above the $28.00 level and traded as high as $28.22.
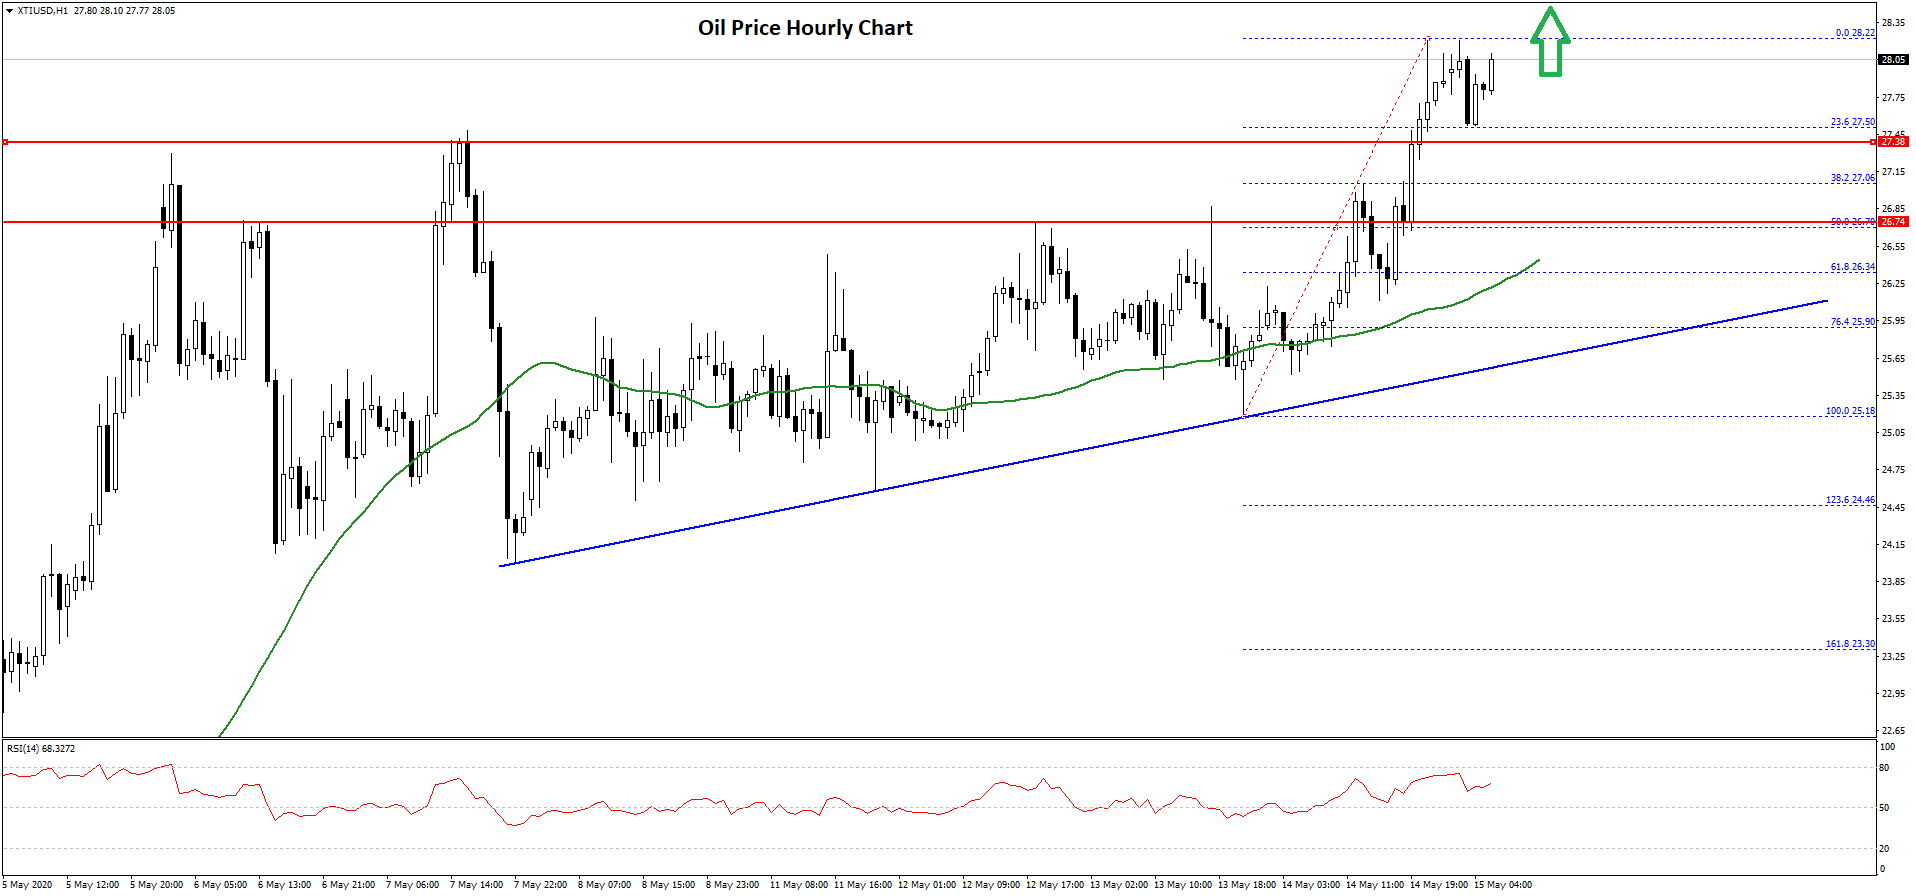
It is currently consolidating gains and recently tested the 23.6% Fib retracement level of the upward move from the $25.18 low to $28.22 high. On the downside, the first key support is seen near the $27.40 level.
The next major support is near the $26.75 level (the previous breakout zone). It is close to the 50% Fib retracement level of the upward move from the $25.18 low to $28.22 high.
More importantly, there is a crucial bullish trend line forming with support near $26.00 on the hourly chart of XTI/USD. An intermediate support is near the $26.35 level and the 50 hourly SMA.
Therefore, dips are likely to remain well supported near $26.75 and $26.35. To move into a bearish zone, the price must move below the $26.00 support. Conversely, oil price might continue to rise above $28.00 and $28.500.
The next major resistance on the upside is near the $30.00 level, above which it could test $31.20.
Trade over 50 forex markets 24 hours a day with FXOpen. Take advantage of low commissions, deep liquidity, and spreads from 0.0 pips. Open your FXOpen account now or learn more about trading forex with FXOpen.
This article represents the opinion of the Companies operating under the FXOpen brand only. It is not to be construed as an offer, solicitation, or recommendation with respect to products and services provided by the Companies operating under the FXOpen brand, nor is it to be considered financial advice.
Latest from Forex Analysis
Latest articles

Weekly Market Wrap With Gary Thomson: UK100, USD, GOLD, OIL
Get the latest scoop on the week's hottest headlines, all in one convenient video. Join Gary Thomson, the COO of FXOpen UK, as he breaks down the most significant news reports and shares his expert insights.
- UK100 Share Index Rises

What Is a Darvas Box Theory and How Does It Work in Trading?
The Darvas Box Theory, pioneered by Nicolas Darvas in the 1950s, has transcended its stock market origins to become a valuable tool for forex traders. This method leverages specific price movements and patterns, known as the Darvas Box, to track

NFLX Stock Price Falls Despite Subscriber Growth
Yesterday, after the close of the main trading session on the stock market, Netflix reported to investors for the 1st quarter of 2024.
The report turned out better than expected:
→ earnings per share: actual = USD 5.28, forecast = USD 4.