


FXOpen

Gold price is trading nicely in a positive zone above the $1,475 support area. Crude oil price is also showing positive signs and it could continue to rise above $59.00 and $60.00.
Important Takeaways for Gold and Oil
- Gold price rallied recently above the $1,460 and $1,475 resistance levels against the US Dollar.
- There is a contracting triangle forming with resistance near $1,478 on the hourly chart of gold.
- Crude oil price remains well supported above the $57.00 and $57.60 levels.
- There was a break above a major bearish trend line with resistance near $57.15 on the hourly chart of XTI/USD.
Gold Price Technical Analysis
Earlier this week, gold price formed a strong support near the $1,452 and $1,453 levels against the US Dollar. As a result, there was a nice upward move above the $1,460 and $1,470 resistance levels.
Moreover, there was a break below the $1,475 resistance and 50 hourly simple moving average. Finally, there was a break above the $1,480 level and the price traded as high as $1,483 on FXOpen.
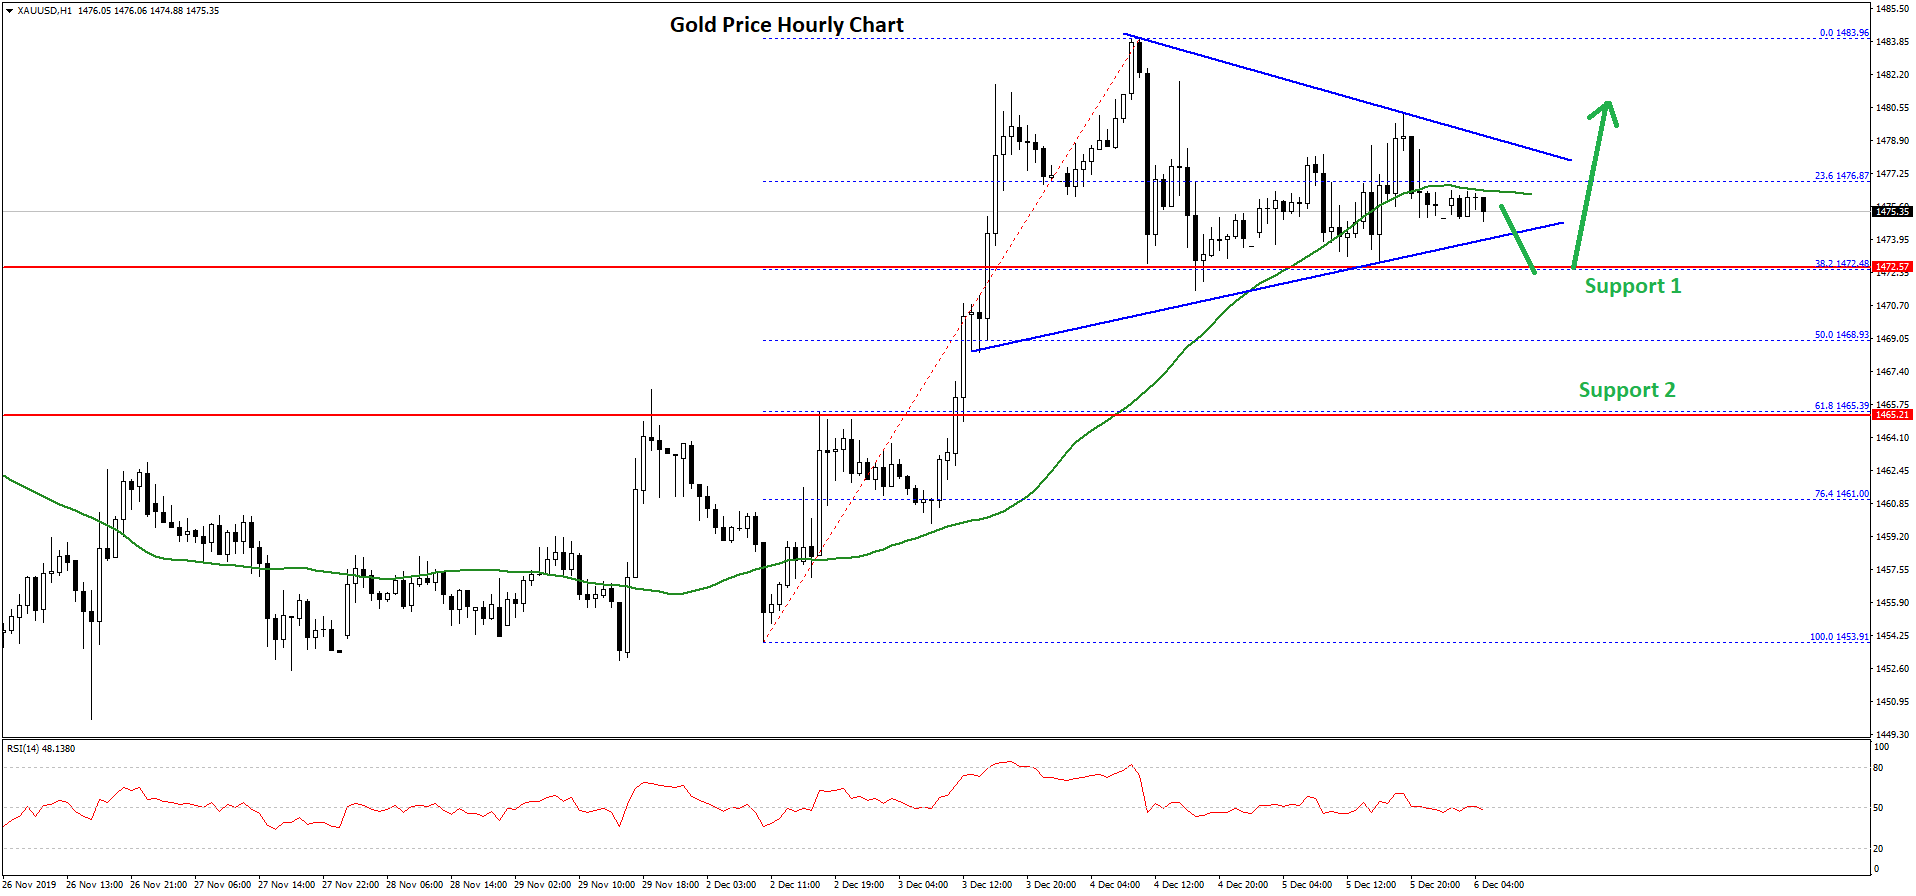
Recently, there was a downside correction below the $1,480 and $1,478 levels. The price traded below the 23.6% Fib retracement level of the upward move from the $1,453 low to $1,483 high.
However, the price is holding the $1,472 and $1,470 support levels. Besides, it seems like the 38.2% Fib retracement level of the upward move from the $1,453 low to $1,483 high is providing support.
More importantly, there is a contracting triangle forming with resistance near $1,478 on the hourly chart of gold. If there is an upside break above the $1,478 and $1,480 resistance levels, the price is likely to continue higher.
The next major resistance is near the $1,485 level, above which gold price may perhaps rise towards the $1,500 level in the near term.
On the downside, an initial support is near the $1,472 level. If gold price fails to stay above the $1,472 support, there are chances of a push towards the $1,465 support area.
Oil Price Technical Analysis
This week, there was a nice upward move in crude oil price from the $55.40 support area against the US Dollar. The price even climbed above the $56.50 resistance area to move into a positive zone.
Furthermore, there was a break above the $57.00 hurdle and the 50 hourly simple moving average. More importantly, there was a break above a major bearish trend line with resistance near $57.15 on the hourly chart of XTI/USD.
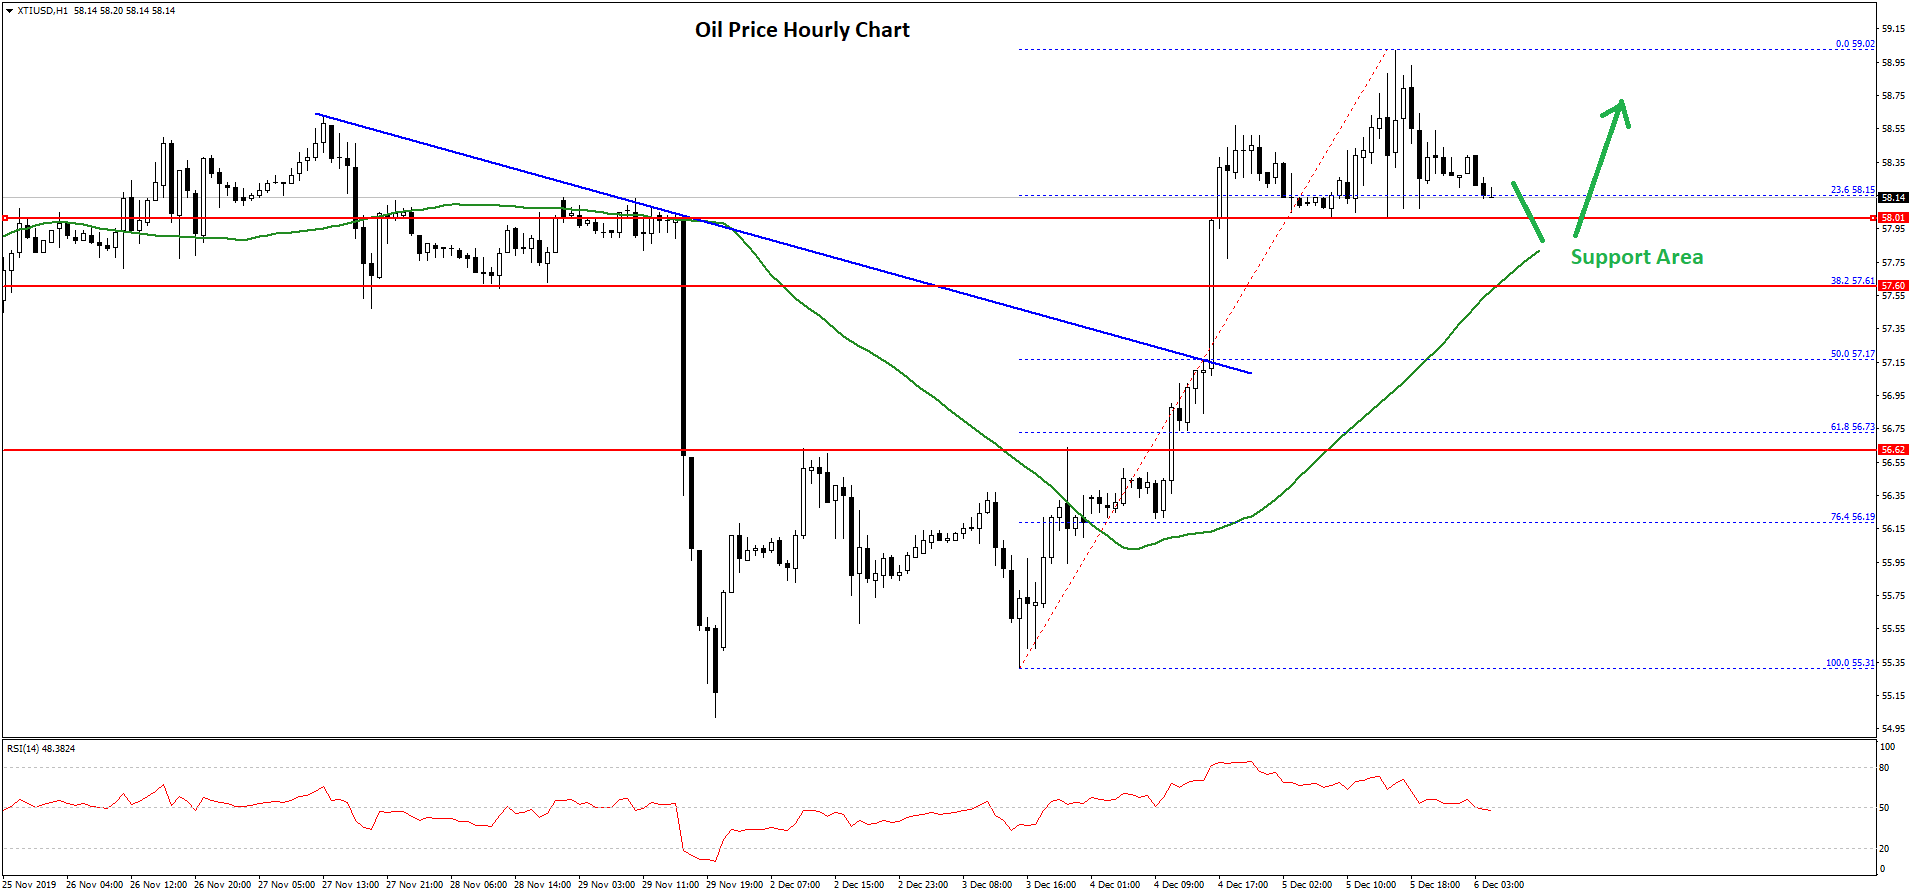
It opened the doors for more gains above the $58.00 level. The price traded as high as $56.02 and it is currently correcting lower. It is testing the 23.6% Fib retracement level of the recent wave from the $55.31 low to $59.02 high.
On the downside, there are many supports near $57.75, $57.70 and $57.60. The 50 hourly simple moving average is also near the $57.75 level.
Besides, the 38.2% Fib retracement level of the recent wave from the $55.31 low to $59.02 high is near $57.17. If there are more downsides, the price could revisit the $57.00 support area.
Conversely, crude oil price could resume its upward move above the $58.50 and $59.00 resistance levels in the near term.
Trade over 50 forex markets 24 hours a day with FXOpen. Take advantage of low commissions, deep liquidity, and spreads from 0.0 pips. Open your FXOpen account now or learn more about trading forex with FXOpen.
This article represents the opinion of the Companies operating under the FXOpen brand only. It is not to be construed as an offer, solicitation, or recommendation with respect to products and services provided by the Companies operating under the FXOpen brand, nor is it to be considered financial advice.
Latest from Forex Analysis
Latest articles

Anchored VWAP and How You Can Use It in Forex Trading
In the world of forex trading, understanding the nuanced tools at your disposal can significantly enhance decision-making processes. One such sophisticated tool is the Anchored Volume-Weighted Average Price (Anchored VWAP), which refines the standard VWAP by allowing traders to set

META Share Price Collapses after Publication of Quarterly Report
Just yesterday, META's stock price closed at USD 493.50, up approximately 40% since the start of 2024 and up nearly 300% since the start of 2023.
However, following the release of Meta's quarterly report, its shares plummeted to USD

USD/JPY Analysis: The Rate Exceeds The Level of 155 Yen Per US Dollar
Today, the price of USD/JPY once again renewed its 34-year high, exceeding the level of 155 yen per dollar, which put pressure on the current authorities.
According to Reuters, officials are trying to maintain calm in the market.
"We