


FXOpen

Gold price rallied recently above the $1,520 and $1,530 resistance levels. Crude oil price is also rising and it could continue to climb higher towards the $64.00 resistance.
Important Takeaways for Gold and Oil
- Gold price surged in the past few days and recently tested $1,540 against the US Dollar.
- There is a key bullish trend line forming with support near $1,532 on the hourly chart of gold.
- Crude oil price spiked recently above the $62.00 resistance area.
- There was a break above a major bearish trend line with resistance near $61.05 on the hourly chart of XTI/USD.
Gold Price Technical Analysis
In the past few days, gold price remained in a strong uptrend above the $1,500 level against the US Dollar. The price even broke the key $1,520 resistance area to continue higher.
Moreover, there was a close above the $1,520 level and the 50 hourly simple moving average. The price recently traded to a new 2020 high at $1,540 on FXOpen and it is still showing a lot of positive signs.
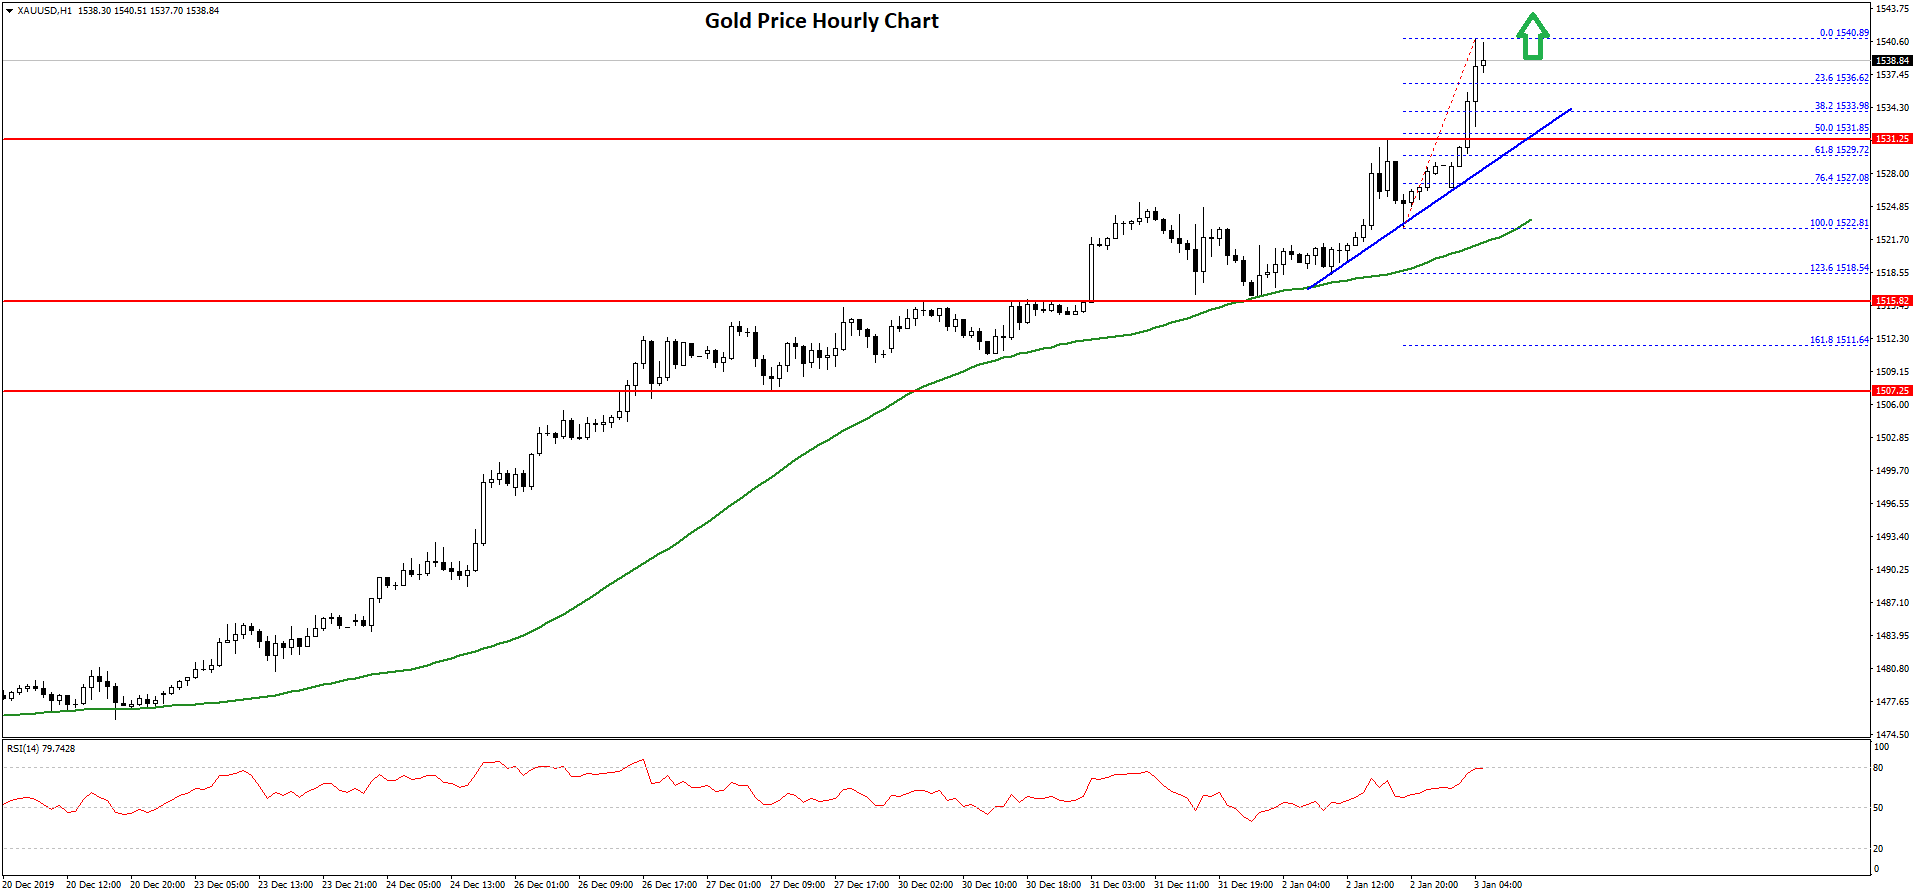
An initial support is near the $1,536 level. It coincides with the 23.6% Fib retracement level of the upward move from the $1,522 low to $1,540 high.
The main support on the downside is near the $1,532 level. Besides, there is a key bullish trend line forming with support near $1,532 on the hourly chart of gold.
The trend line coincides with the 50% Fib retracement level of the upward move from the $1,522 low to $1,540 high. If there is a downside break below the trend line, the price might correct lower towards the $1,525 and $1,520 support levels.
On the upside, an immediate resistance is near the $1,540 level, above which gold price might climb towards the $1,545 level. Any further gains could lead the price towards the $1,550 resistance area in the near term.
Oil Price Technical Analysis
In the past few days, crude oil price consolidated above the $60.00 support against the US Dollar. Finally, the bulls took control and they were able to push the price above the $61.00 and $62.00 resistance levels.
Besides, there was a break above a major bearish trend line with resistance near $61.05 on the hourly chart of XTI/USD. The price spiked above the $63.00 resistance area and settled above the 50 hourly simple moving average.
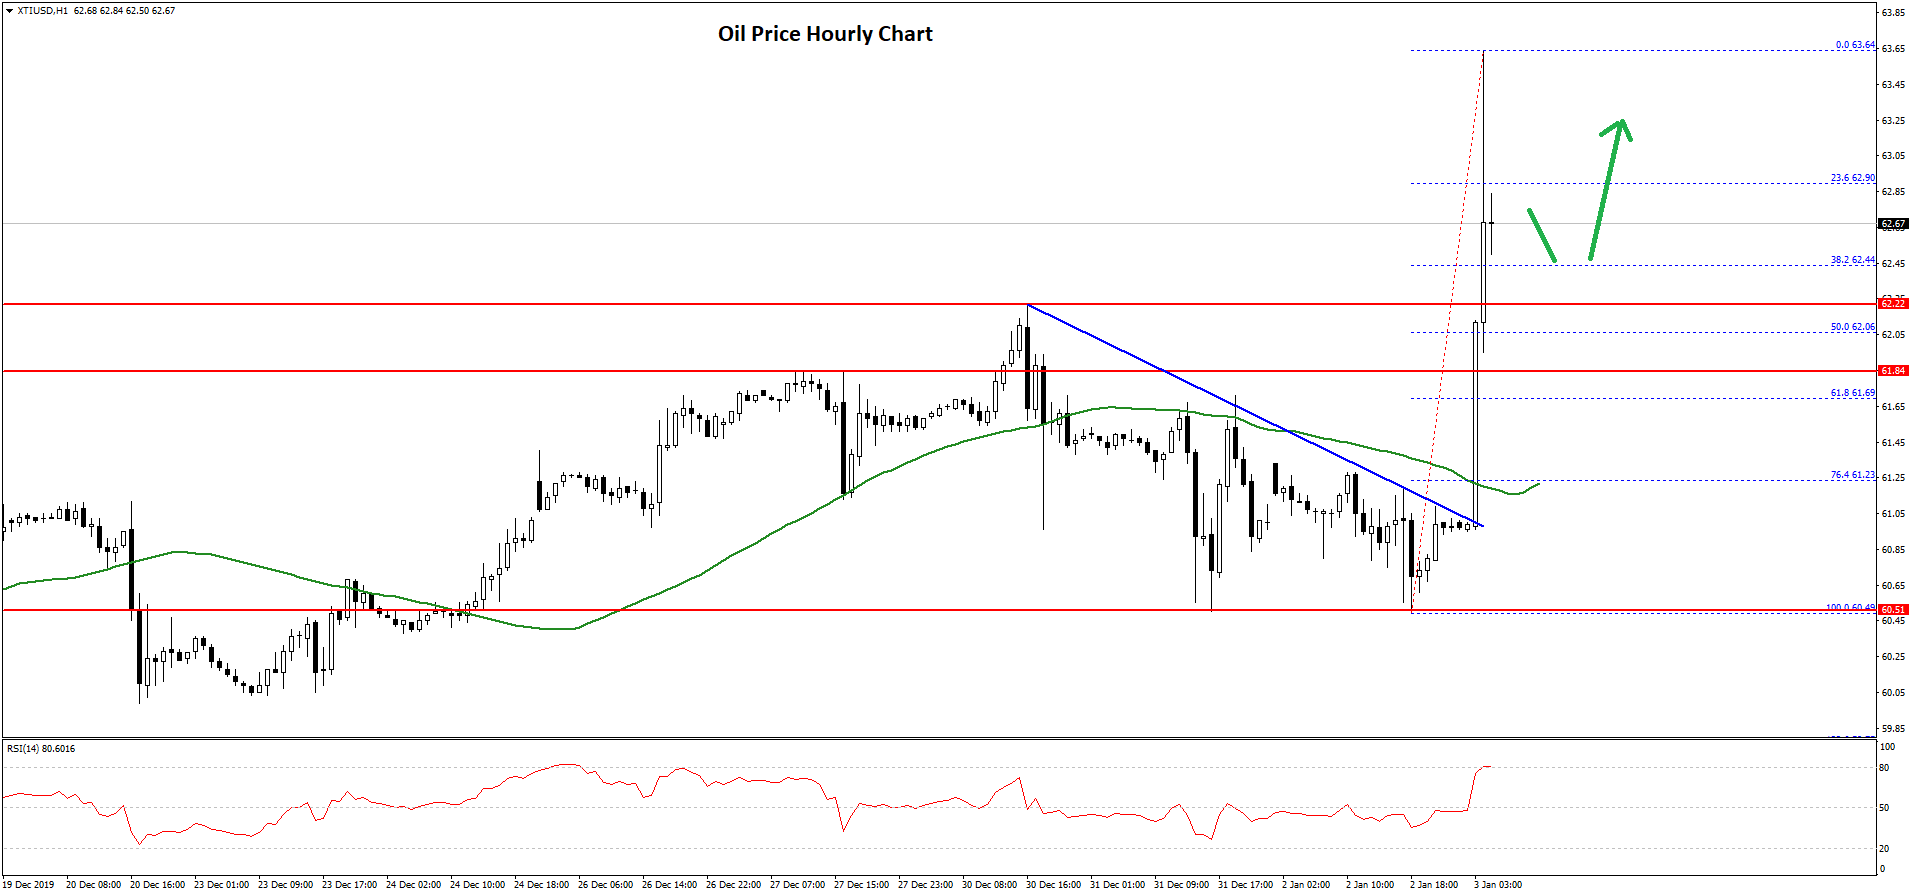
It traded as high as $63.64 recently and it is currently correcting lower. It is trading below the 23.6% Fib retracement level of the recent rally from the $60.49 low to $63.64 high.
On the downside, there are many supports near $62.20 and $62.00. Moreover, the 50% Fib retracement level of the recent rally from the $60.49 low to $63.64 high is near the $62.00 area to protect the decline.
Any further losses may perhaps lead the price back towards the $61.20 support and the 50 hourly simple moving average. The next major support is near the $60.20 and $60.00 levels.
Conversely, crude oil price could continue to climb higher above $62.80 and $63.00. The main hurdle is near the $63.50 level, above which there are high chances of a push towards the $64.50 and $65.00 resistance levels in the near term.
Trade over 50 forex markets 24 hours a day with FXOpen. Take advantage of low commissions, deep liquidity, and spreads from 0.0 pips. Open your FXOpen account now or learn more about trading forex with FXOpen.
This article represents the opinion of the Companies operating under the FXOpen brand only. It is not to be construed as an offer, solicitation, or recommendation with respect to products and services provided by the Companies operating under the FXOpen brand, nor is it to be considered financial advice.
Latest from Forex Analysis
Latest articles

Google Share Price Rose Post-market to a New All-time Record
Yesterday, after the close of the main trading session, a report on activities for the 1st quarter of Alphabet Inc. (Google's parent company) was published. The report was strong, exceeding investors' expectations.
→ Quarterly EPS = USD 1.89 (expected = USD 1.

S&P 500 Rebounds after Negative GDP News
Data released yesterday showed US GDP growth slowed to 1.6% in the first quarter of the year. According to ForexFactory: forecast = 2.2%, past value = 2.4%.
Reaction to the news sent the S&P 500 mini stock

GBP/USD And USD/CAD Daily Chart Outlook
GBP/USD is attempting a recovery wave from 1.2300. USD/CAD is consolidating and might aim for a move above the 1.3760 resistance zone.
Important Takeaways for GBP/USD and USD/CAD Analysis Today
· The British Pound started