


FXOpen

Gold price rallied to a new multi-year high above $1,775 before correcting lower. Crude oil price is currently recovering from $37.15, but it is facing many hurdles.
Important Takeaways for Gold and Oil
- Gold price traded to a new multi-year high at $1,779 before correcting lower against the US Dollar.
- There is a major bullish trend line forming with support near $1,758 on the hourly chart of gold.
- Crude oil price started a fresh increase after trading as low as $37.15.
- There was a break above a key bearish trend line with resistance near $38.50 on the hourly chart of XTI/USD.
Gold Price Technical Analysis
Gold price remained in an uptrend and started a fresh increase above the $1,750 resistance against the US Dollar. The price broke the $1,760 resistance level and trade to a new multi-year high.
It traded as high as $1,779 on FXOpen and recently started a downside correction. It declined below the $1,760 support level and the 50 hourly simple moving average. However, the $1,755 region acted as a support and a low is formed near $1,754.
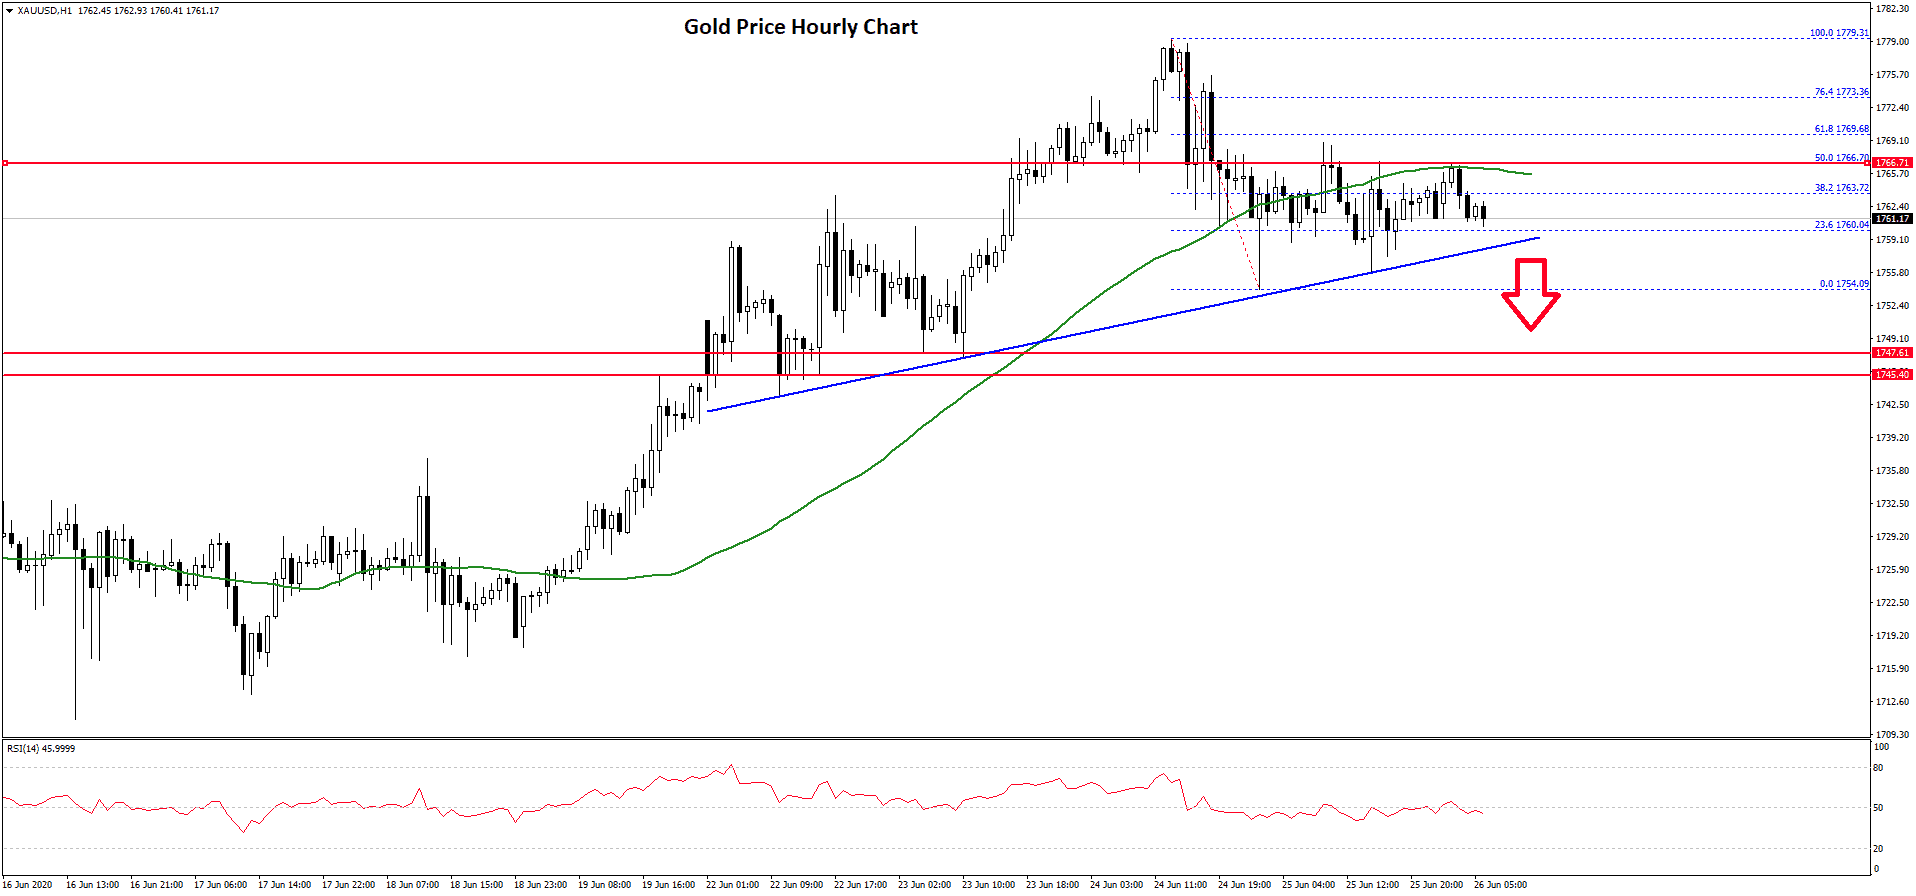
The price is currently consolidating in a range and it managed to recover above the 23.6% Fib retracement level of the recent decline from the $1,779 high to $1,754 low.
It seems like there is a major bullish trend line forming with support near $1,758 on the hourly chart of gold. On the upside, the price is facing hurdles near the $1,766 and $1,770 levels.
The 50% Fib retracement level of the recent decline from the $1,779 high to $1,754 low is also near $1,669. Therefore, the price must break the $1,766 and $1,770 resistance levels to continue higher in the coming sessions.
The next major hurdle is at $1,780, followed by $1,788. Conversely, the price could break the trend line support at $1,758 and start a fresh decline. The main support is near the $1,748 zone, below which gold price might start a substantial drop in the coming days.
Oil Price Technical Analysis
Crude oil price gained traction in the past few days and it even surged above $40.00 against the US Dollar. The price traded as high as $41.60 before starting a major downward move.
It broke the $40.00 and $39.50 support levels to move into a short term bearish zone. It traded as low as $37.15 and recently started a fresh increase. There was a break above the 23.6% Fib retracement level of the recent decline from the $41.60 high to $37.15 low.
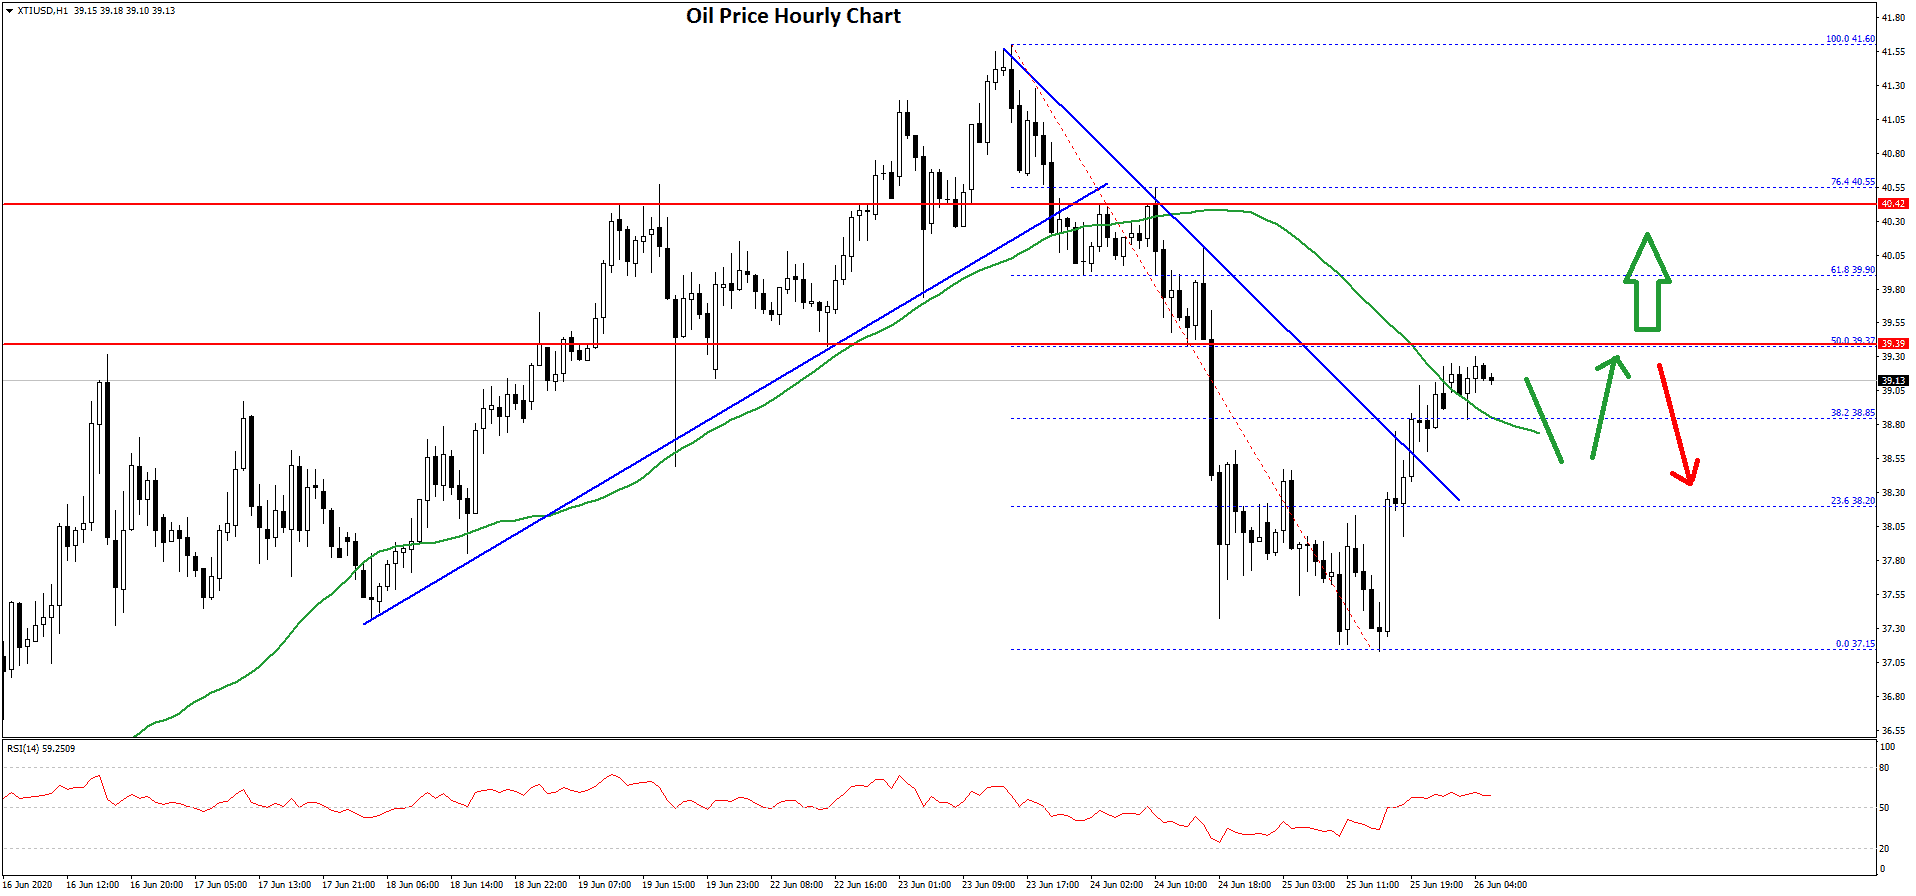
Moreover, there was a break above a key bearish trend line with resistance near $38.50 on the hourly chart of XTI/USD. The price is now trading above the $39.00 level and the 50 hourly simple moving average.
On the upside, there is a major hurdle forming near the $39.40 level. It is close to the 50% Fib retracement level of the recent decline from the $41.60 high to $37.15 low.
Therefore, an upside break above the $39.40 and $39.50 levels is needed for a fresh increase in the coming sessions. Conversely, the price might resume its decline below the $39.00 and $38.80 levels.
The main support is near the $38.00 level, below which the price could even break the $37.15 low and trade towards the $36.50 support region.
Trade over 50 forex markets 24 hours a day with FXOpen. Take advantage of low commissions, deep liquidity, and spreads from 0.0 pips. Open your FXOpen account now or learn more about trading forex with FXOpen.
This article represents the opinion of the Companies operating under the FXOpen brand only. It is not to be construed as an offer, solicitation, or recommendation with respect to products and services provided by the Companies operating under the FXOpen brand, nor is it to be considered financial advice.
Latest from Forex Analysis
Latest articles

What Order Imbalance Is and How To Use It in a Trading Strategy
Understanding the nuances of order imbalances is key for traders looking to navigate the ebb and flow of asset prices. Order imbalances provide a clear window into the supply and demand dynamics at play, offering strategic insights. This article delves

XAU/USD Gold Price Reaches an Important Resistance Zone
The XAU/USD gold chart today indicates that the historical record price of the metal is above USD 2,400 per ounce.
In addition to fears of a new round of inflation due to rising commodity prices, geopolitical tensions are

What Is a Break of Structure and How Can You Trade It?
In the ever-evolving world of Smart Money Concept (SMC) trading, a nuanced understanding of market dynamics is indispensable. This article explores the concept of Break of Structure (BOS), how to identify it, and its implications for trading strategies, setting traders