


FXOpen

Gold price started a fresh decline after it failed to clear the $1,930 resistance. Crude oil price is currently holding the $40.50 support and eyeing the next key break.
Important Takeaways for Gold and Oil
- Gold price extended its rise towards $1,930 before correcting lower against the US Dollar.
- There is a major bullish trend line forming with support near $1,900 on the hourly chart of gold.
- Crude oil price formed a strong support near the $39.75 level before climbing higher.
- There is a key bearish trend line forming with resistance near $40.80 on the hourly chart of XTI/USD.
Gold Price Technical Analysis
Gold price followed a bullish path above the $1,900 support level and started a fresh increase against the US Dollar. The price broke the $1,915 and $1,920 resistance levels.
However, the price struggled to clear the $1,930 resistance zone. A high was formed near $1,931 on FXOpen before the price started a fresh decline. There was a break below the $1,910 support level and the 50 hourly simple moving average.
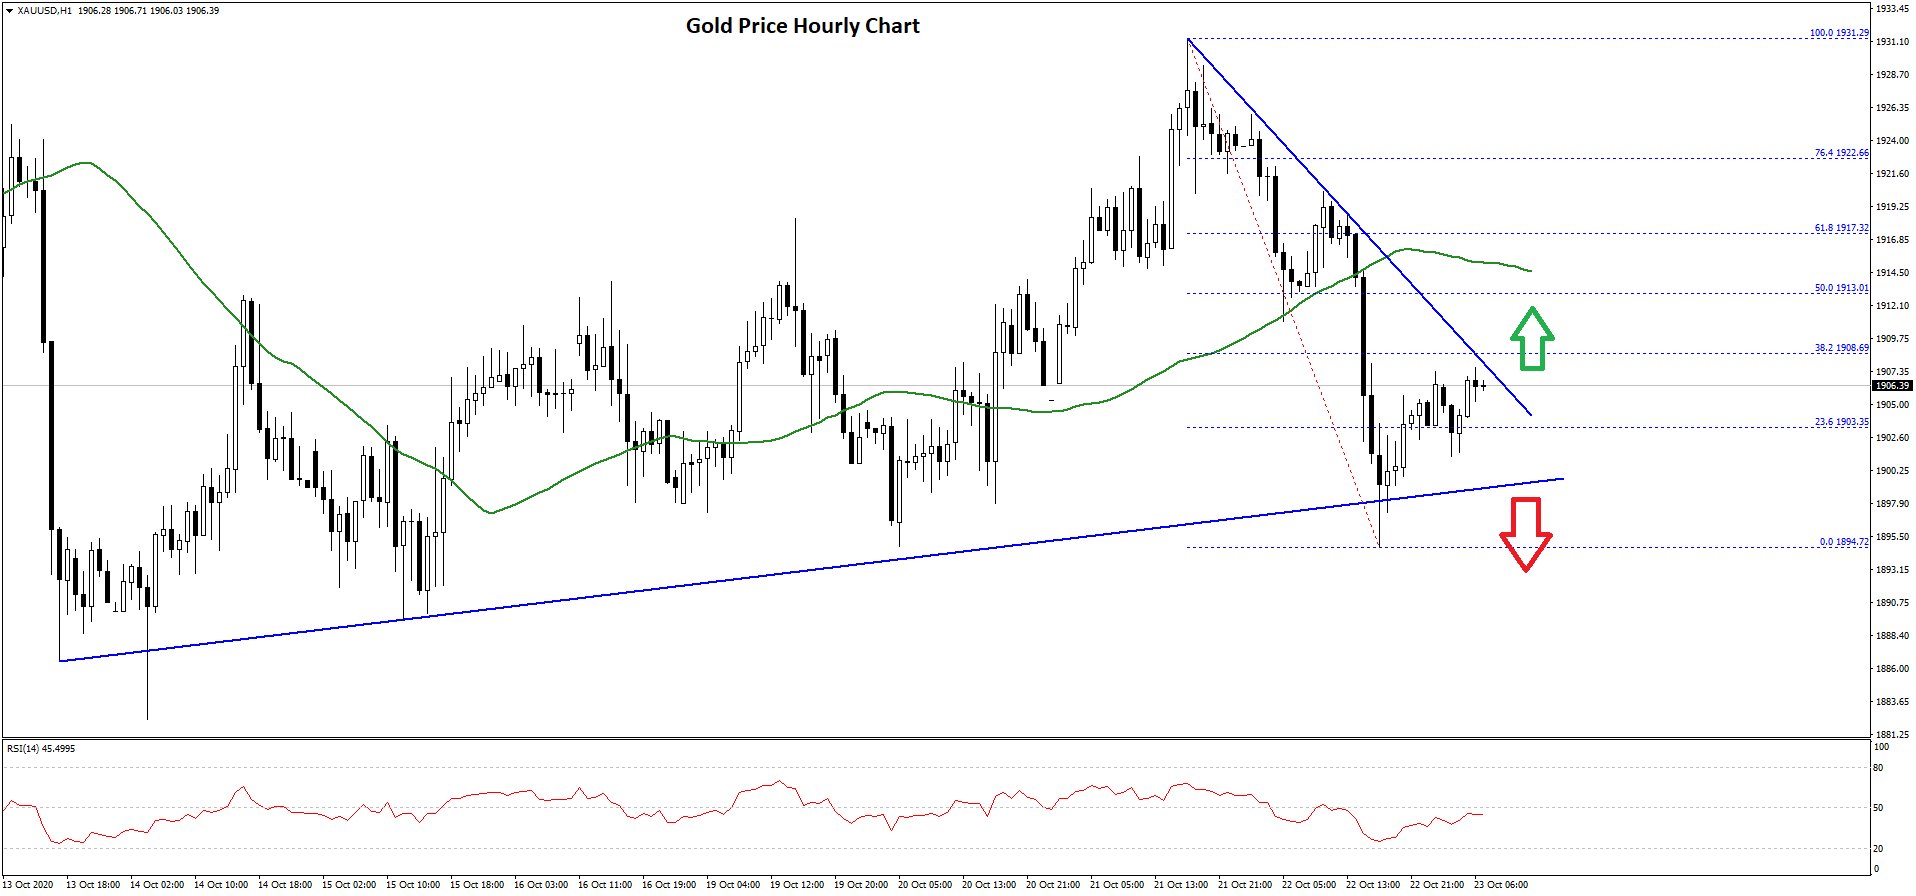
The decline was such that the price spiked below the $1,900 support and traded as low as $1,894. Recently, there was a recovery wave above the $1,900 level.
The price even climbed above the 23.6% Fib retracement level of the recent decline from the $1,931 high to $1,894 low. The price is now facing hurdles near the $1,905 and $1,908 levels.
It seems like there is a major bullish trend line forming with support near $1,900 on the hourly chart of gold. If there is a downside break below the trend line support, the price could decline sharply. The next major support is near the $1,895 level, below which the bears might aim a test of $1,880.
Conversely, a clear break above the $1,908 and $1,910 resistance levels could open the doors for a fresh increase. The next key resistance is near the $1,915 level and the 50 hourly simple moving average, above which the price might revisit the $1,930 resistance zone.
Oil Price Technical Analysis
Crude oil price remained well bid above the $39.50 and $39.75 support levels against the US Dollar. As a result, there was a fresh increase and the price climbed above $40.00.
The price gained pace above the $40.50 resistance level, plus the 50% Fib retracement level of the downward move from the $41.90 high to $39.76 low. The price even spiked above the $40.80 resistance and the 50 hourly simple moving average.
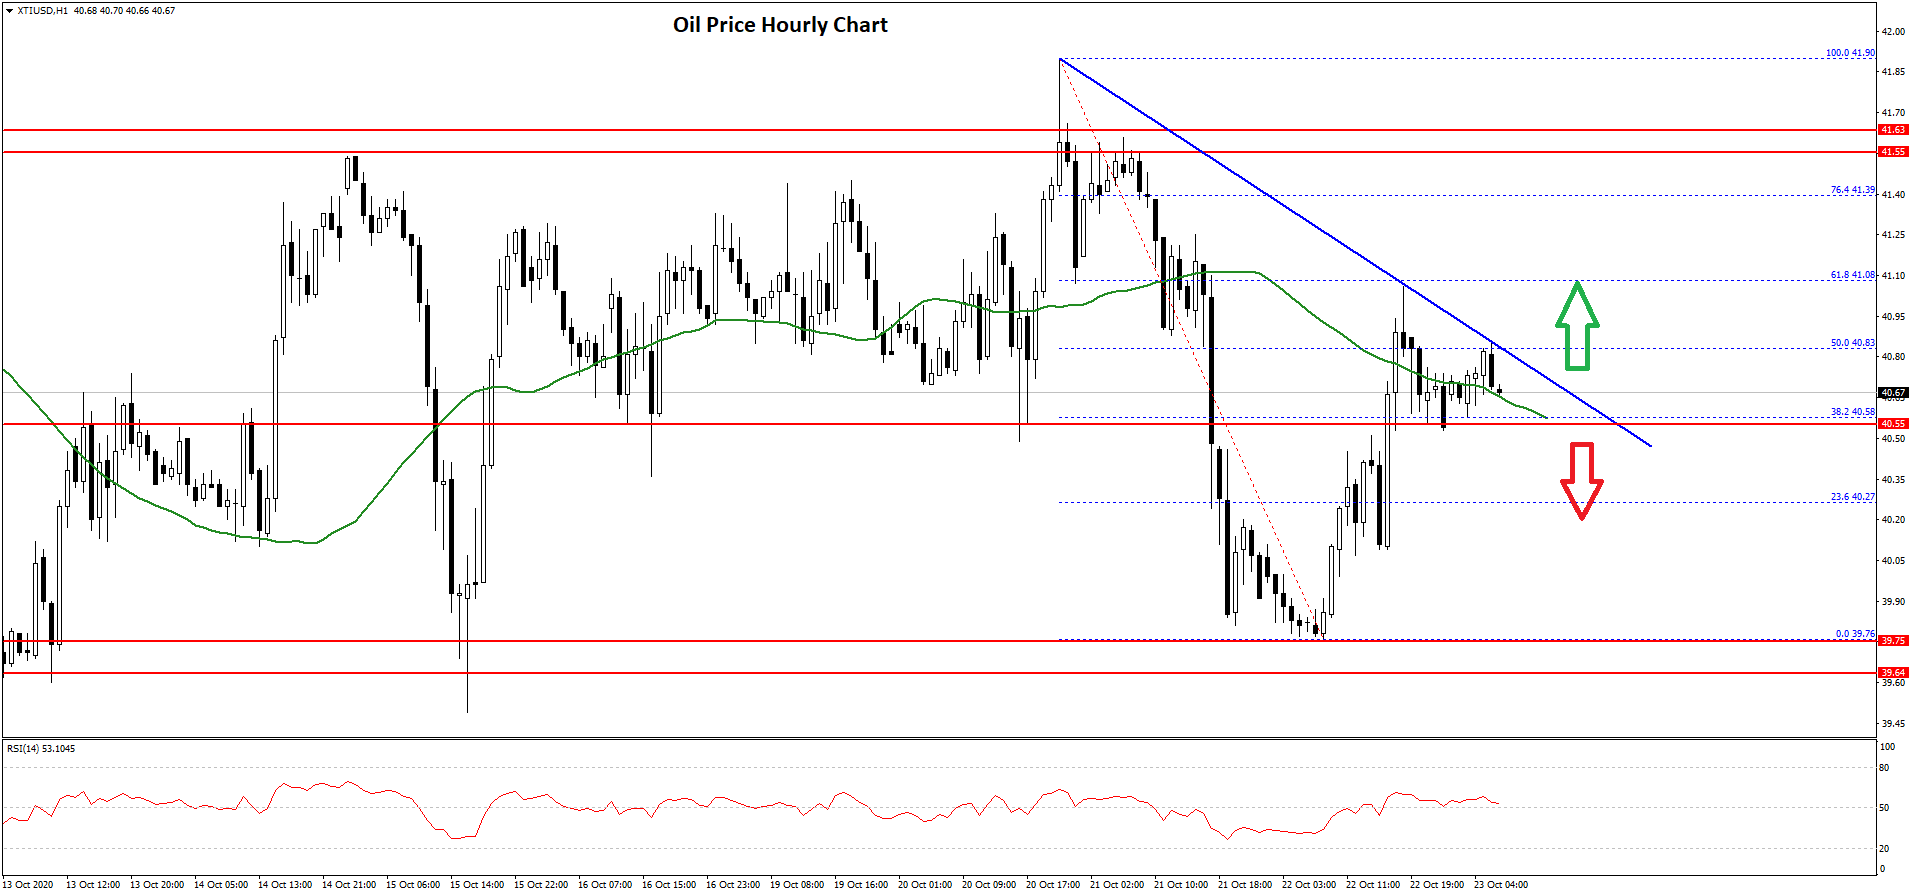
However, the bulls struggled to gain pace above the $41.00 resistance level. It seems like the bears defended the 61.8% Fib retracement level of the downward move from the $41.90 high to $39.76 low.
The price is currently consolidating above the $40.60 and $40.50 support levels. There is also a key bearish trend line forming with resistance near $40.80 on the hourly chart of XTI/USD.
If there is a downside break below the $40.50 support level, the price is likely to restart its decline. The next major support is at $40.00, followed by $39.75.
On the upside, a clear break above the trend line resistance and then a follow up move above $41.00 is must for more gains in the coming sessions.
Trade over 50 forex markets 24 hours a day with FXOpen. Take advantage of low commissions, deep liquidity, and spreads from 0.0 pips. Open your FXOpen account now or learn more about trading forex with FXOpen.
This article represents the opinion of the Companies operating under the FXOpen brand only. It is not to be construed as an offer, solicitation, or recommendation with respect to products and services provided by the Companies operating under the FXOpen brand, nor is it to be considered financial advice.
Latest from Forex Analysis
Latest articles

The Price of Gold XAU/USD Shows Strongest Fall in Almost 2 Years
On Monday, the price of gold fell from USD 2,386 to USD 2,333 per ounce — this is the strongest drop in one day in almost 2 years, according to Bloomberg. On Tuesday morning in the Asian session, the

Hong Kong-listed Chinese Insurer Goes on Rally as Western Giants Retract
The Asia Pacific region has once again become an area of great interest to investors and traders as some remarkable patterns of volatility have begun to make their presence felt.
This morning, a few examples of Hong Kong-listed Chinese companies

Bitcoin Price Bullish after Halving-2024
On April 19, 2024, a halving occurred in the Bitcoin network, resulting in the reward for the mined block amounting to 3.125 BTC.
Historically, after the halving (which is associated with a reduction in supply), the price of Bitcoin