


FXOpen

Gold price started a fresh increase above the $1,740 resistance zone. Crude oil price is also rising and it is likely to continue higher above $63.50.
Important Takeaways for Gold and Oil
- Gold price gained pace after it broke the $1,720 and $1,740 resistance levels against the US Dollar.
- There was a break above a key bearish trend line with resistance near $1,745 on the hourly chart of gold.
- Crude oil price climbed higher nicely and it settled above the $62.00 support zone.
- There is a major bullish trend line forming with support near $62.45 on the hourly chart of XTI/USD.
Gold Price Technical Analysis
Earlier this week, gold price formed a decent support base above the $1,725 level against the US Dollar. As a result, there was a fresh increase above the $1,730 and $1,740 levels.
There was a break above a key bearish trend line with resistance near $1,745 on the hourly chart of gold. The price gained pace above the $1,750 level and it settled well above the 50 hourly simple moving average.
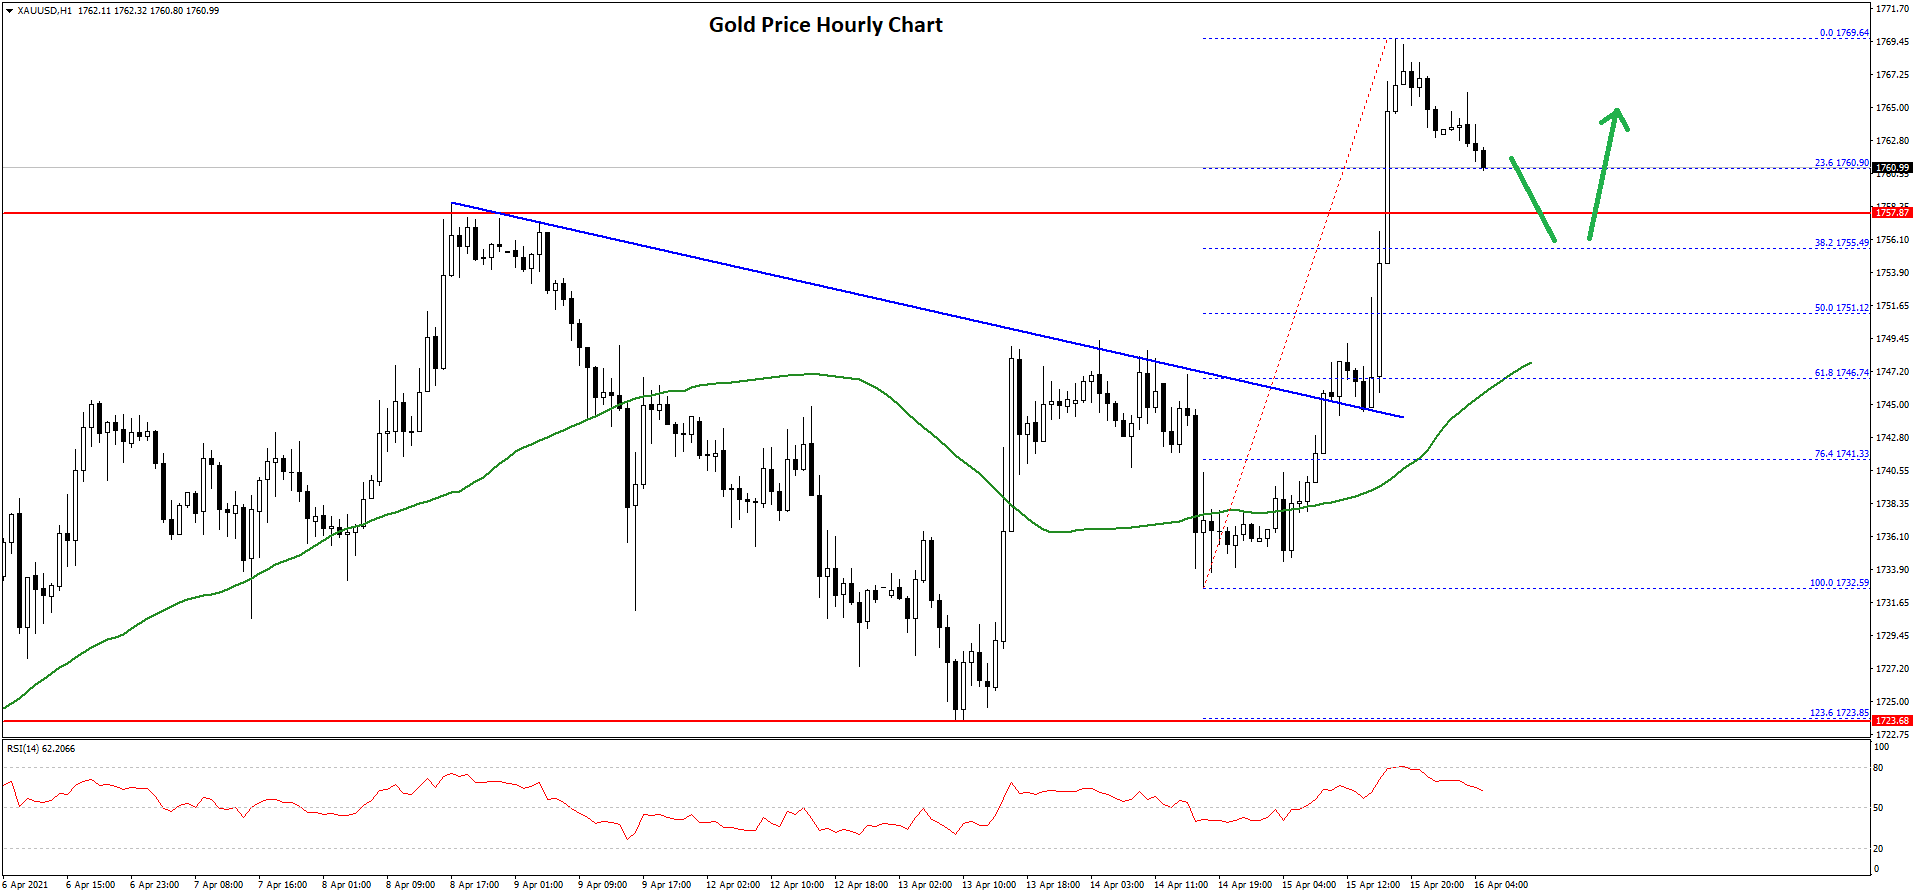
It even traded above the $1,765 level and a high is formed near $1,769 on FXOpen. The price is now correcting lower and trading below the $1,765 level.
It is testing the 23.6% Fib retracement level of the upward move from the $1,732 low to $1,769 high. An immediate support on the downside is near the $1,758 level. The next major support on the downside is near the $1,755 level.
Any more losses might call for a test of the $1,750 support. It is near the 50% Fib retracement level of the upward move from the $1,732 low to $1,769 high.
On the upside, the $1,768 and $1,770 levels are immediate hurdles. A clear break above $1,770 might open the doors for a steady increase towards the $1,780 level. The next key resistance is near the $1,800 level.
Oil Price Technical Analysis
Crude oil price remained well bid above the $58.50 support level against the US Dollar. The price gained pace and recently settled nicely above the $60.00 level.
The price climbed higher steadily above the $61.50 and $62.00 resistance levels. There was also a close above the $62.50 level and the 50 hourly simple moving average. A high is formed near $63.59 and the price is now consolidating gains.
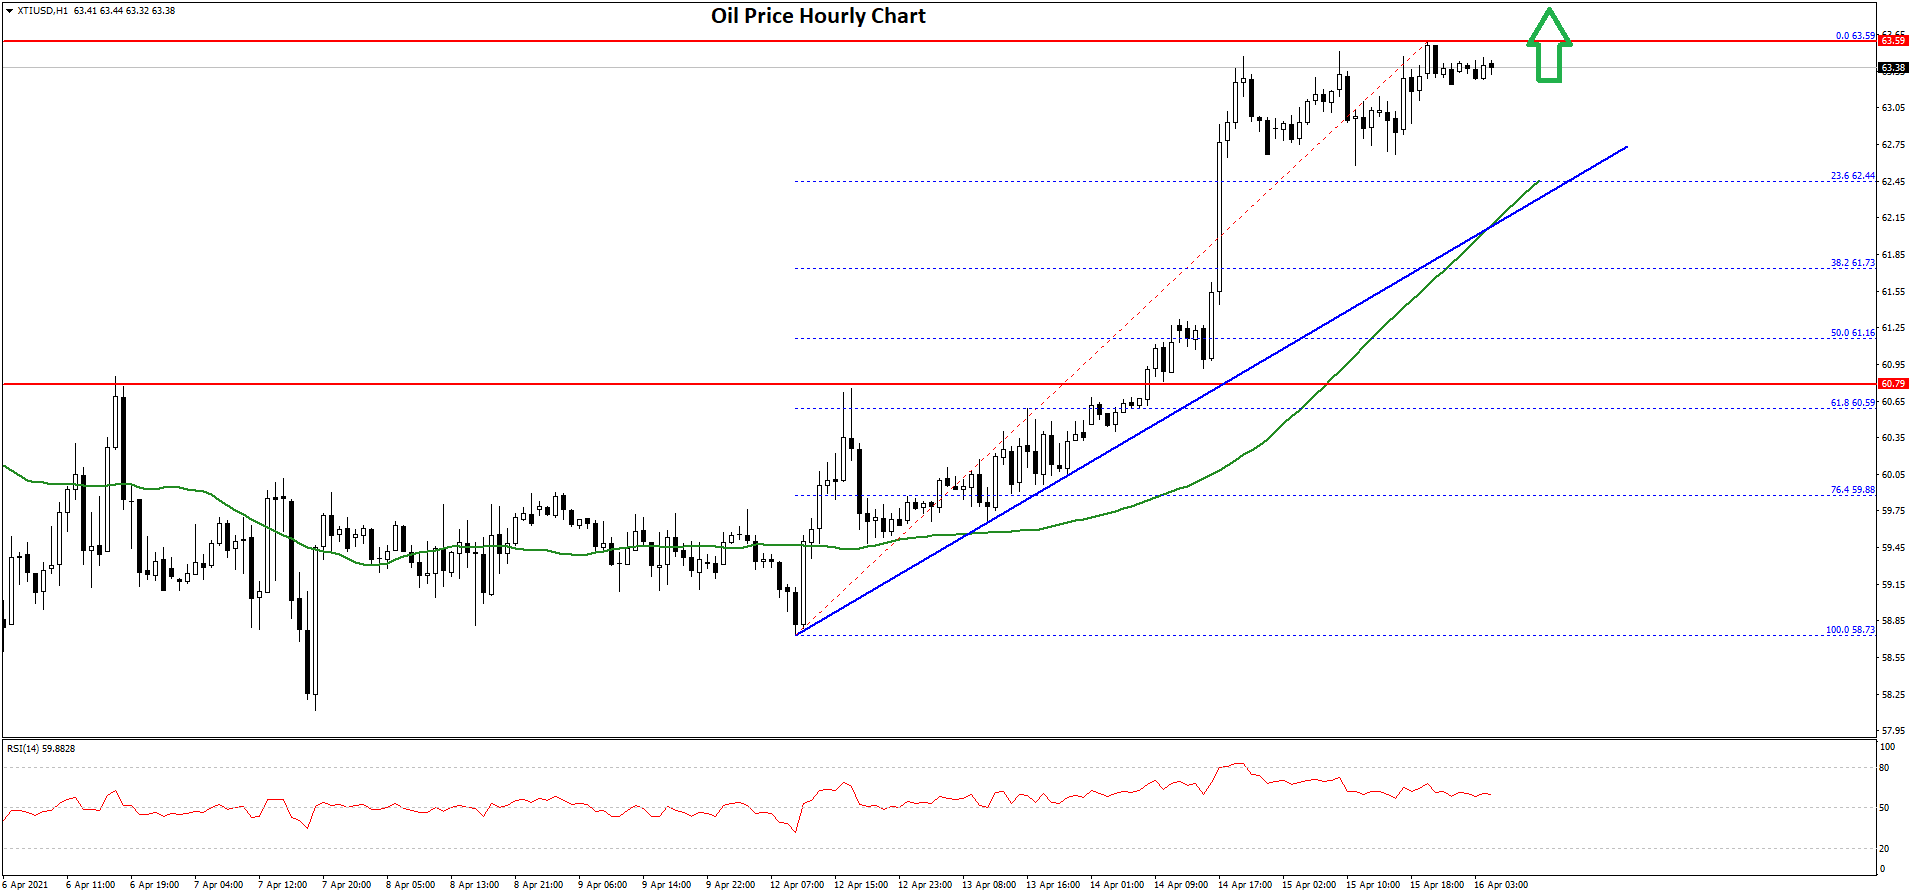
An initial support on the downside is near the $62.50 level. It is near the 23.6% Fib retracement level of the recent wave from the $58.73 low to $63.59 high.
There is also a major bullish trend line forming with support near $62.45 on the hourly chart of XTI/USD. Any more losses might call for a move towards the $61.20 level. The 50% Fib retracement level of the recent wave from the $58.73 low to $63.59 high is also near $61.16.
An intermediate support on the downside is near the $61.80 level, where the bulls are likely to take a strong stand. Conversely, the price might resume its rise above the $63.60 and $63.80 levels.
If there is an upside break above $63.80, the price could rally towards the $64.80 and $65.00 levels. The next major resistance is near the $65.50 level.
This forecast represents FXOpen Markets Limited opinion only, it should not be construed as an offer, invitation or recommendation in respect to FXOpen Markets Limited products and services or as financial advice.
Trade over 50 forex markets 24 hours a day with FXOpen. Take advantage of low commissions, deep liquidity, and spreads from 0.0 pips. Open your FXOpen account now or learn more about trading forex with FXOpen.
This article represents the opinion of the Companies operating under the FXOpen brand only. It is not to be construed as an offer, solicitation, or recommendation with respect to products and services provided by the Companies operating under the FXOpen brand, nor is it to be considered financial advice.
Latest from Forex Analysis
Latest articles

Germany's DAX 40 Index Flying High Despite Pessimistic National Outlook
For a number of years now, there has been a lot of discourse over the current situation and the future of the German domestic economy.
From both inside Germany and globally, analysts, government officials, and corporate leaders have demonstrated a

Volatility in the Pound Is Rising, the Euro is Consolidating
GBP/USD
At the end of last week, the British currency fell sharply, testing a significant support level at 1.2300. The resumption of the downward trend for the pair became possible after some statements by British officials:
- On Wednesday,

The Price of Gold XAU/USD Shows Strongest Fall in Almost 2 Years
On Monday, the price of gold fell from USD 2,386 to USD 2,333 per ounce — this is the strongest drop in one day in almost 2 years, according to Bloomberg. On Tuesday morning in the Asian session, the