


FXOpen

Gold price started a fresh increase and surged towards the $1,950 resistance. Crude oil price also gained pace and it is currently correcting lower from $39.50.
Important Takeaways for Gold and Oil
- Gold price rallied towards the $1,950 resistance and currently correcting gains against the US Dollar.
- Earlier, there was a break above a major contracting triangle with resistance near $1,910 on the hourly chart of gold.
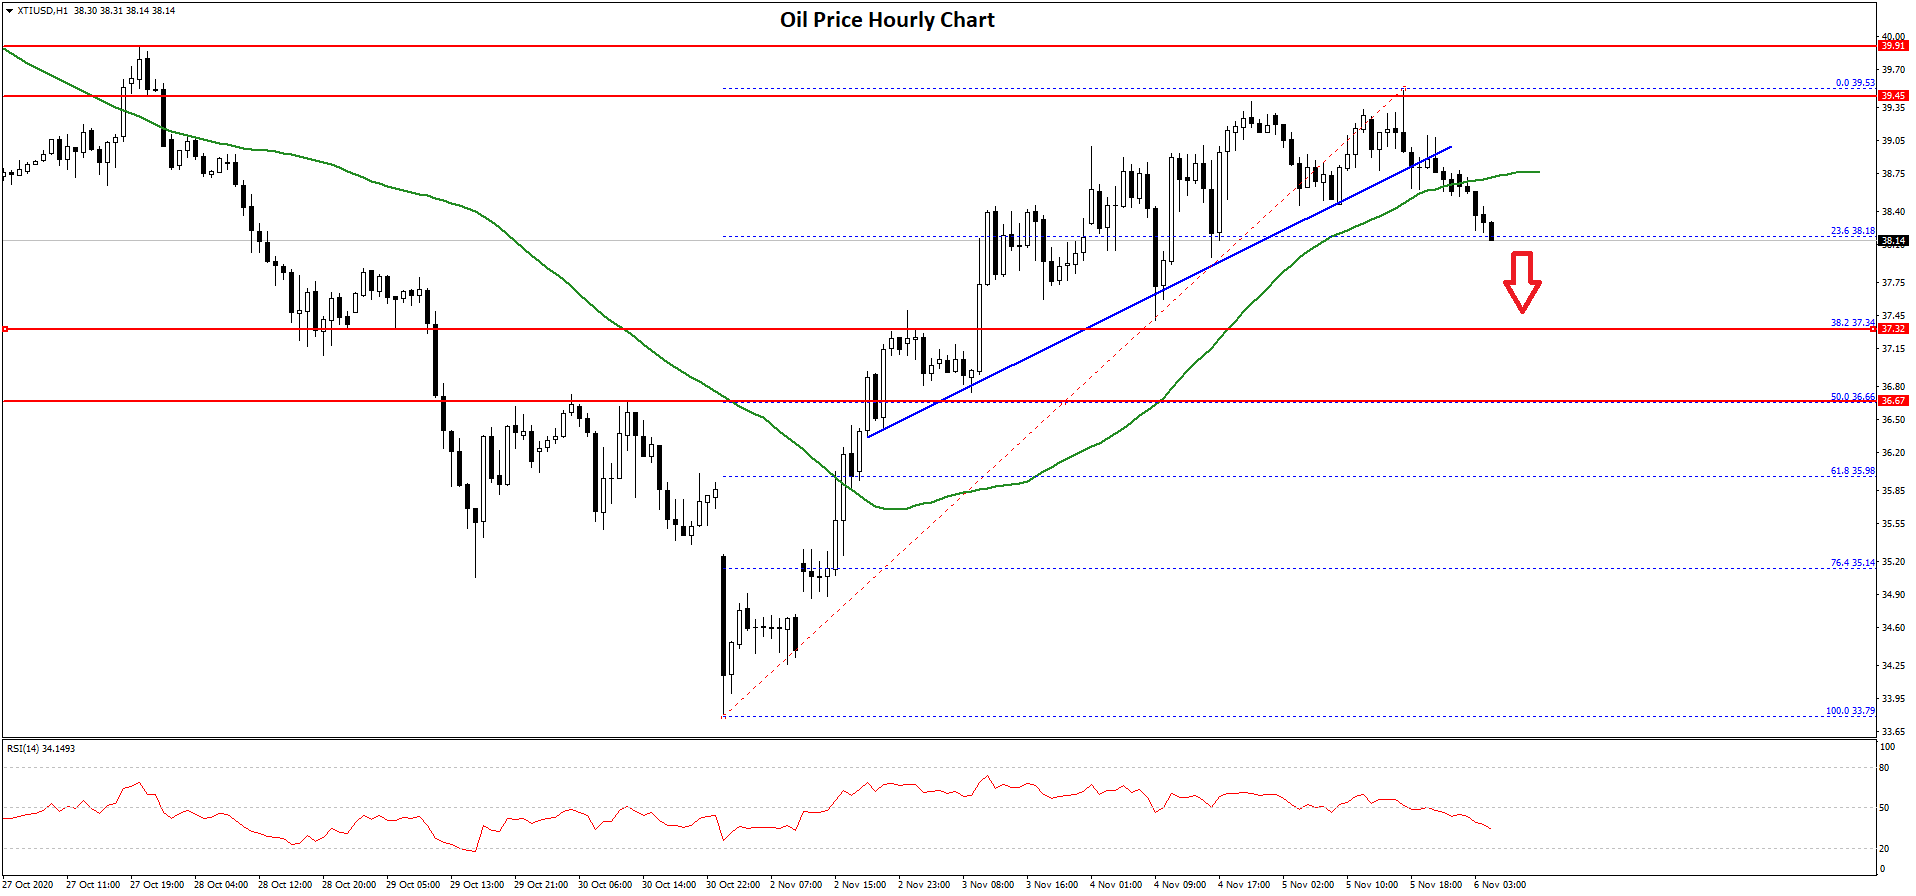
- Crude oil price seems to be facing a strong resistance near $39.50 and $40.00.
- There was a break below a key bullish trend line with support near $39.00 on the hourly chart of XTI/USD.
Gold Price Technical Analysis
Gold price started a strong increase from the $1,880 support zone against the US Dollar. The price broke the $1,895 and $1,900 resistance levels to move into a positive zone.
More importantly, there was a break above a major contracting triangle with resistance near $1,910 on the hourly chart of gold. It opened the doors for a sharp rise and the price rallied above $1,920.
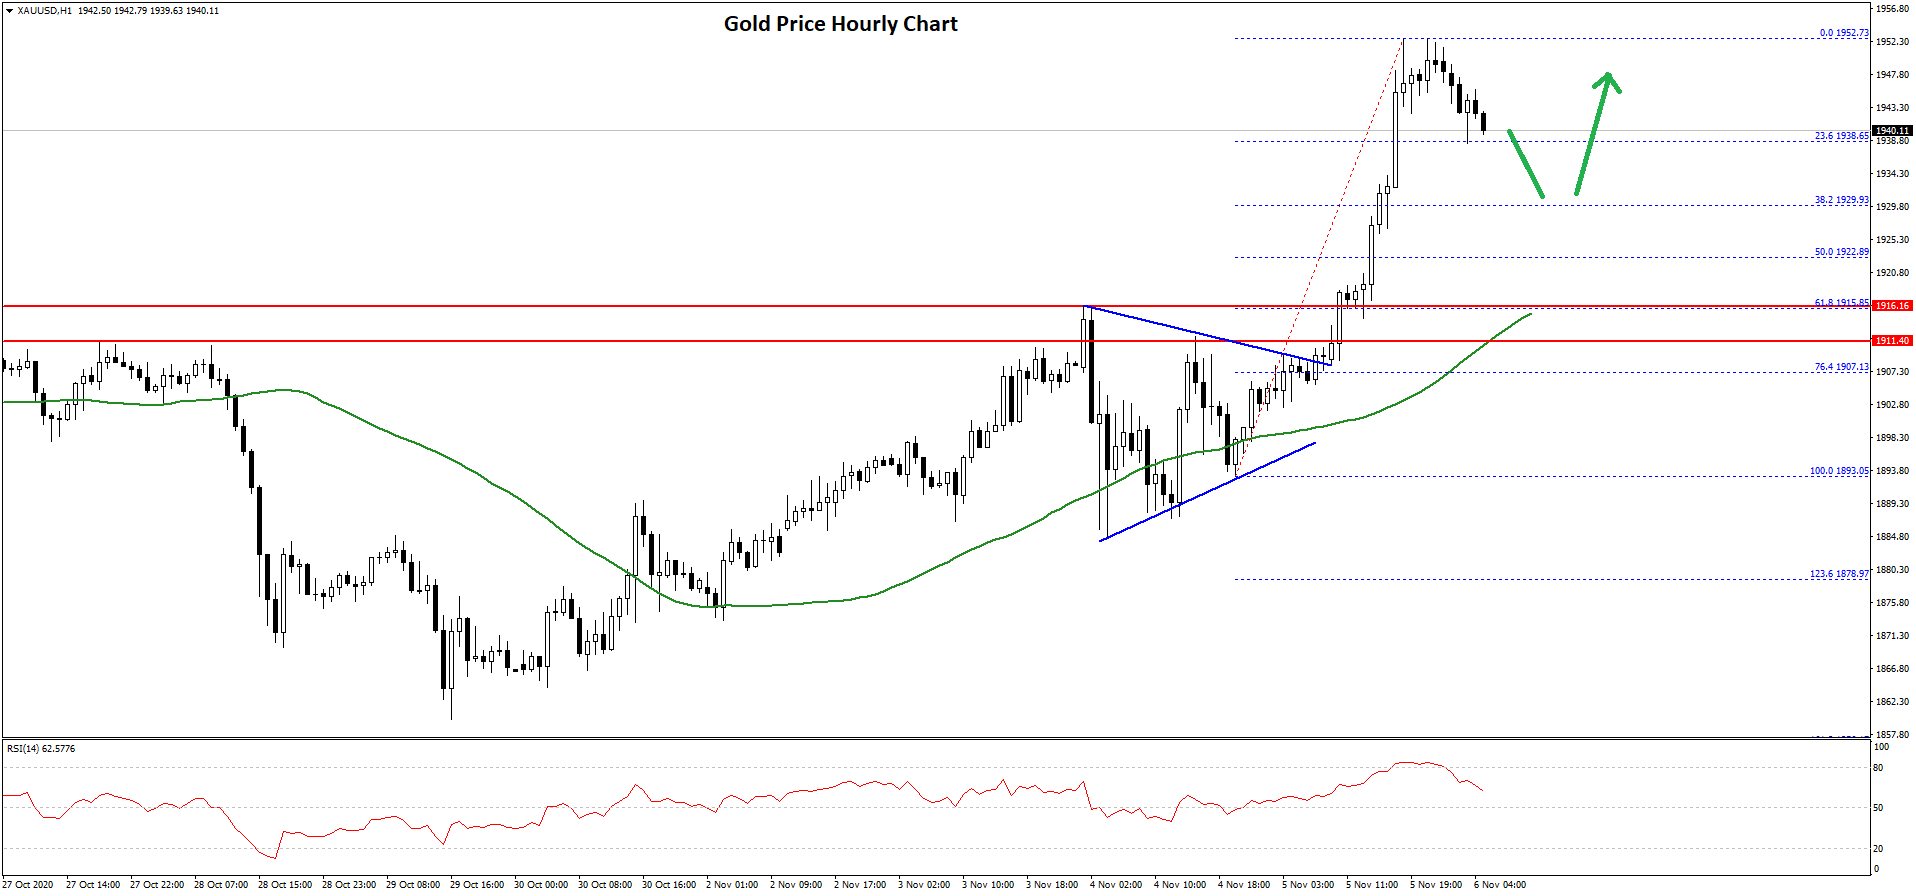
There was also a close above $1,925 and the 50 hourly simple moving average. It even tested the $1,950 resistance and high is formed near $1,952 on FXOpen. The price is currently correcting gains and trading below $1,945.
An initial support is near the $1,938 level. It is close to the 23.6% Fib retracement level of the recent rise from the $1,893 swing low to $1,952 high.
The next major support is near the $1,920 level or the 50% Fib retracement level of the recent rise from the $1,893 swing low to $1,952 high. Any further losses could lead the price towards the $1,915 support zone (the recent breakout zone, resistance turned support).
Conversely, the price could start a fresh increase above $1,945. The next key resistance is near the $1,950 level, above which the price might rally towards the $1,965 level in the near term.
Oil Price Technical Analysis
Crude oil price found support near the $33.80 level after a massive decline against the US Dollar. As a result, there was a fresh recovery wave above the $35.00 and $36.50 resistance levels.
The price gained pace above the $37.00 resistance level and the 50 hourly simple moving average. However, the bulls seem to be facing a strong resistance near $39.50 and $40.00. There were more than two attempts to gain strength above $39.50, but the bulls failed.
 gold
gold
A high is formed near $39.53 and the price is currently correcting lower. There was a break below the $39.00 support and the 50 hourly simple moving average. There was also a break below a key bullish trend line with support near $39.00 on the hourly chart of XTI/USD.
The price is now testing the 23.6% Fib retracement level of the recent increase from the $32.79 swing low to $39.53 high. An initial support on the downside is near the $37.80 level.
The first major support is near the $36.65 level since it is close to the 50% Fib retracement level of the recent increase from the $32.79 swing low to $39.53 high. Any further losses may perhaps lead the price towards the $35.00 support level in the near term.
On the upside, an initial hurdle for the bulls is near the $38.80 level and the 50 hourly SMA. However, a clear break above the $39.50 and $40.00 levels is must for a strong increase.
Trade over 50 forex markets 24 hours a day with FXOpen. Take advantage of low commissions, deep liquidity, and spreads from 0.0 pips. Open your FXOpen account now or learn more about trading forex with FXOpen.
This article represents the opinion of the Companies operating under the FXOpen brand only. It is not to be construed as an offer, solicitation, or recommendation with respect to products and services provided by the Companies operating under the FXOpen brand, nor is it to be considered financial advice.
Latest from Forex Analysis
Latest articles

AUD/USD Rises Sharply on Inflation News
The Consumer Price Index for Australia was released this morning. According to ForexFactory:
→ CPI in quarterly terms: actual = 1.0%, expected = 0.8%, previous value = 0.6%;
→ CPI in annual terms: actual = 3.5%, expected = 3.4%, previous value = 3.

TSLA Share Price Up About 13% Despite Disappointing Report
Yesterday, TSLA trading closed at USD 144.68 per share, after which Tesla reported its results for the 1st quarter:
→ earnings per share: actual = USD 0.45, forecast = USD 0.49;
→ gross income: actual = USD 21.45 billion, forecast = USD

Market Analysis: Gold Price Corrects Gains While Oil Price Regains Strength
Gold price rallied above $2,400 before correcting lower. Crude oil price is rising and it could climb further higher toward the $85.50 resistance.
Important Takeaways for Gold and Oil Prices Analysis Today
· Gold price rallied significantly above $2,