


FXOpen

Gold price is showing positive signs above the $1,880 resistance zone. Crude oil price is holding a major support, but it is facing resistance near $70.00.
Important Takeaways for Gold and Oil
- Gold price gained pace above the $1,875 and $1,880 resistance levels against the US Dollar.
- There was a break above a key bearish trend line with resistance near $1,894 on the hourly chart of gold.
- Crude oil price climbed higher and it even cleared the $70.00 resistance zone.
- There is a crucial bullish trend line forming with support near $69.00 on the hourly chart of XTI/USD.
Gold Price Technical Analysis
This week, gold price remained in a positive zone above the $1,865 level against the US Dollar. The bulls were able to push the price above the $1,880 resistance zone.
The price even settled above the $1,885 level and the 50 hourly simple moving average. There was a break above a key bearish trend line with resistance near $1,894 on the hourly chart of gold.
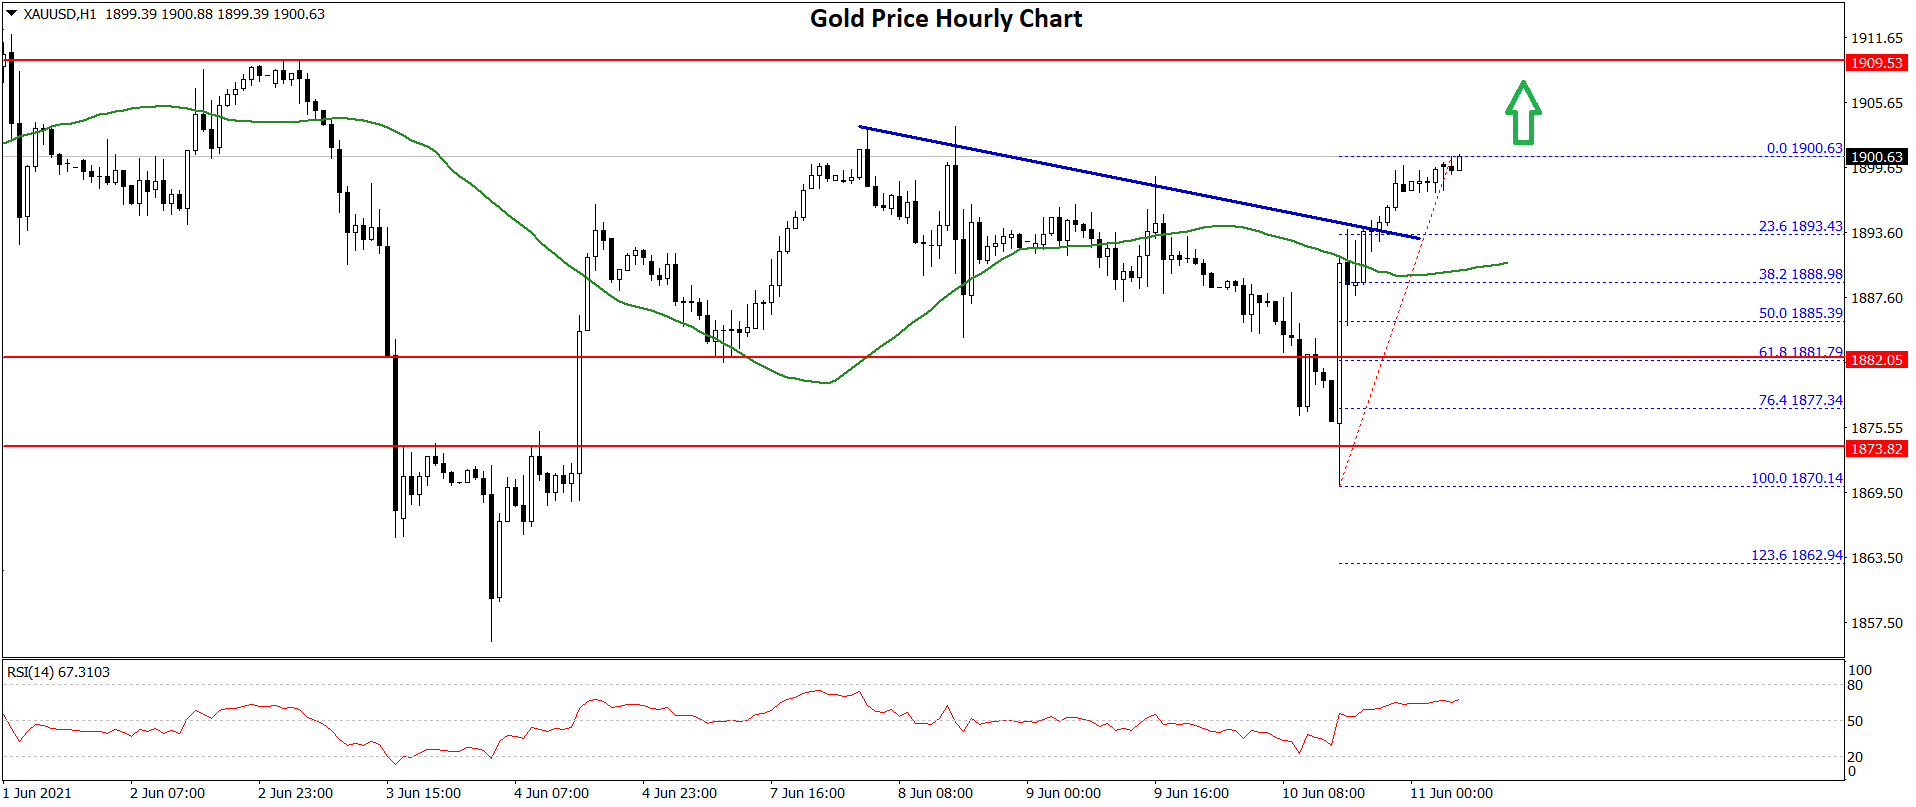
A high is formed near $1,900 on FXOpen and the price is now consolidating gains. An initial support on the downside is near the $1,893 level. It is close to the 23.6% Fib retracement level of the recent increase from the $1,870 swing low to $1,900 high.
The first major support is near the $1,890 level and the 50 hourly simple moving average. The next key support is near the $1,885 level.
The 50% Fib retracement level of the recent increase from the $1,870 swing low to $1,900 high is also near the $1,885 level. Any more losses could open the doors for a move towards the $1,870 low.
An initial resistance is near the $1,905 level. The first major resistance is near the $1,910 level. A clear break above the $1,910 level may possibly open the doors for a move towards the $1,925 level. The next major resistance sits near $1,935.
Oil Price Technical Analysis
Crude oil price is following a bullish path above the $68.00 level against the US Dollar. The price even climbed above the $70.00 level and it traded to a new multi-month high.
A high was formed near $70.47 before the price started a downside correction. There was a spike below the $69.00 level and the 50 hourly simple moving average. A low was formed near $68.51 and the price is now recovering higher.
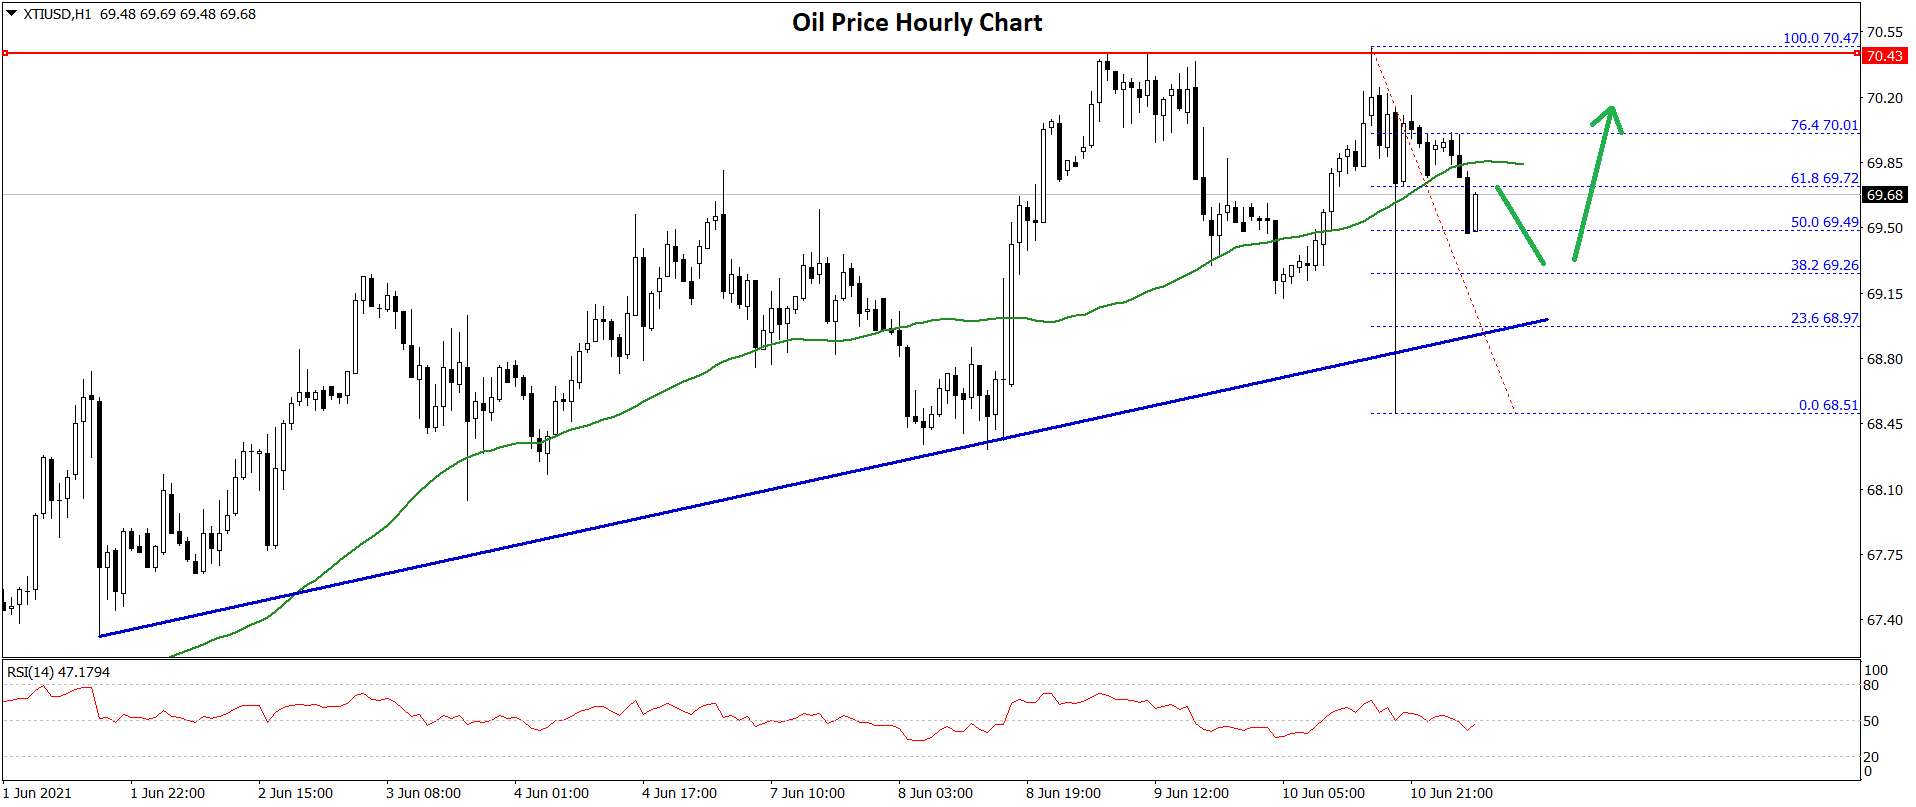
It climbed above the 50% Fib retracement level of the recent decline from the $70.47 high to $68.51 low. It is now facing resistance near the $69.90 level and the 50 hourly simple moving average.
The next resistance is near the $70.00 level. It is close to the 76.4% Fib retracement level of the recent decline from the $70.47 high to $68.51 low. A clear break above $70.00 could pop the price to a new high above the $70.50 level.
On the downside, an initial support is forming near the $69.20 level. The main support is now forming near the $69.00 level. There is also a crucial bullish trend line forming with support near $69.00 on the hourly chart of XTI/USD.
A downside break below the trend line could open the doors for a move towards the $68.00 support level. Any more losses may possibly lead the price towards the $67.20 support zone.
This forecast represents FXOpen Markets Limited opinion only, it should not be construed as an offer, invitation or recommendation in respect to FXOpen Markets Limited products and services or as financial advice.
Trade over 50 forex markets 24 hours a day with FXOpen. Take advantage of low commissions, deep liquidity, and spreads from 0.0 pips. Open your FXOpen account now or learn more about trading forex with FXOpen.
This article represents the opinion of the Companies operating under the FXOpen brand only. It is not to be construed as an offer, solicitation, or recommendation with respect to products and services provided by the Companies operating under the FXOpen brand, nor is it to be considered financial advice.
Latest from Forex Analysis
Latest articles

Fair Value Gaps vs Liquidity Voids in Trading
Understanding fair value gaps and liquidity voids is essential for traders seeking to navigate the complexities of the financial markets. These concepts, deeply rooted in the Smart Money Concept (SMC), provide valuable insights into the dynamics of supply and demand,

UK100 Share Index Rises as UK Inflation Slows
Yesterday, the UK Office for National Statistics (ONS) reported that the CPI stood at 3.2% in March. According to ForexFactory, analysts expected 3.1%, and a month ago the index was 3.4%.
Grant Fitzner, chief economist at the

The Dollar is Corrected after the Comments of the Head of the Federal Reserve
Good data on the labour market in the United States and the continuous rise in inflation for several months are helping to reduce experts’ expectations about a change in the vector of monetary policy in the United States. Recent comments