


FXOpen

Gold price started a fresh increase after testing the $1,680 support zone. Crude oil price is trading nicely above $60.00 and it might continue to rise steadily.
Important Takeaways for Gold and Oil
- Gold price remained well bid near the $1,680 and $1,675 levels against the US Dollar.
- There was a break above a major bearish trend line with resistance near $1,708 on the hourly chart of gold.
- Crude oil price is holding the key $59.50 and $60.00 support levels.
- There was a break above a key bearish trend line with resistance near $60.55 on the hourly chart of XTI/USD.
Gold Price Technical Analysis
Earlier this week, gold price extended its decline below the $1,710 and $1,700 support levels against the US Dollar. However, the bulls were active near the $1,680 and $1,675 levels.
A low was formed near $1,677 on FXOpen before the price started a fresh increase. There was a break above the $1,695 and $1,700 resistance levels. The price climbed nicely above the 50% Fib retracement level of the downward move from the $1,745 swing high to $1,677 low.
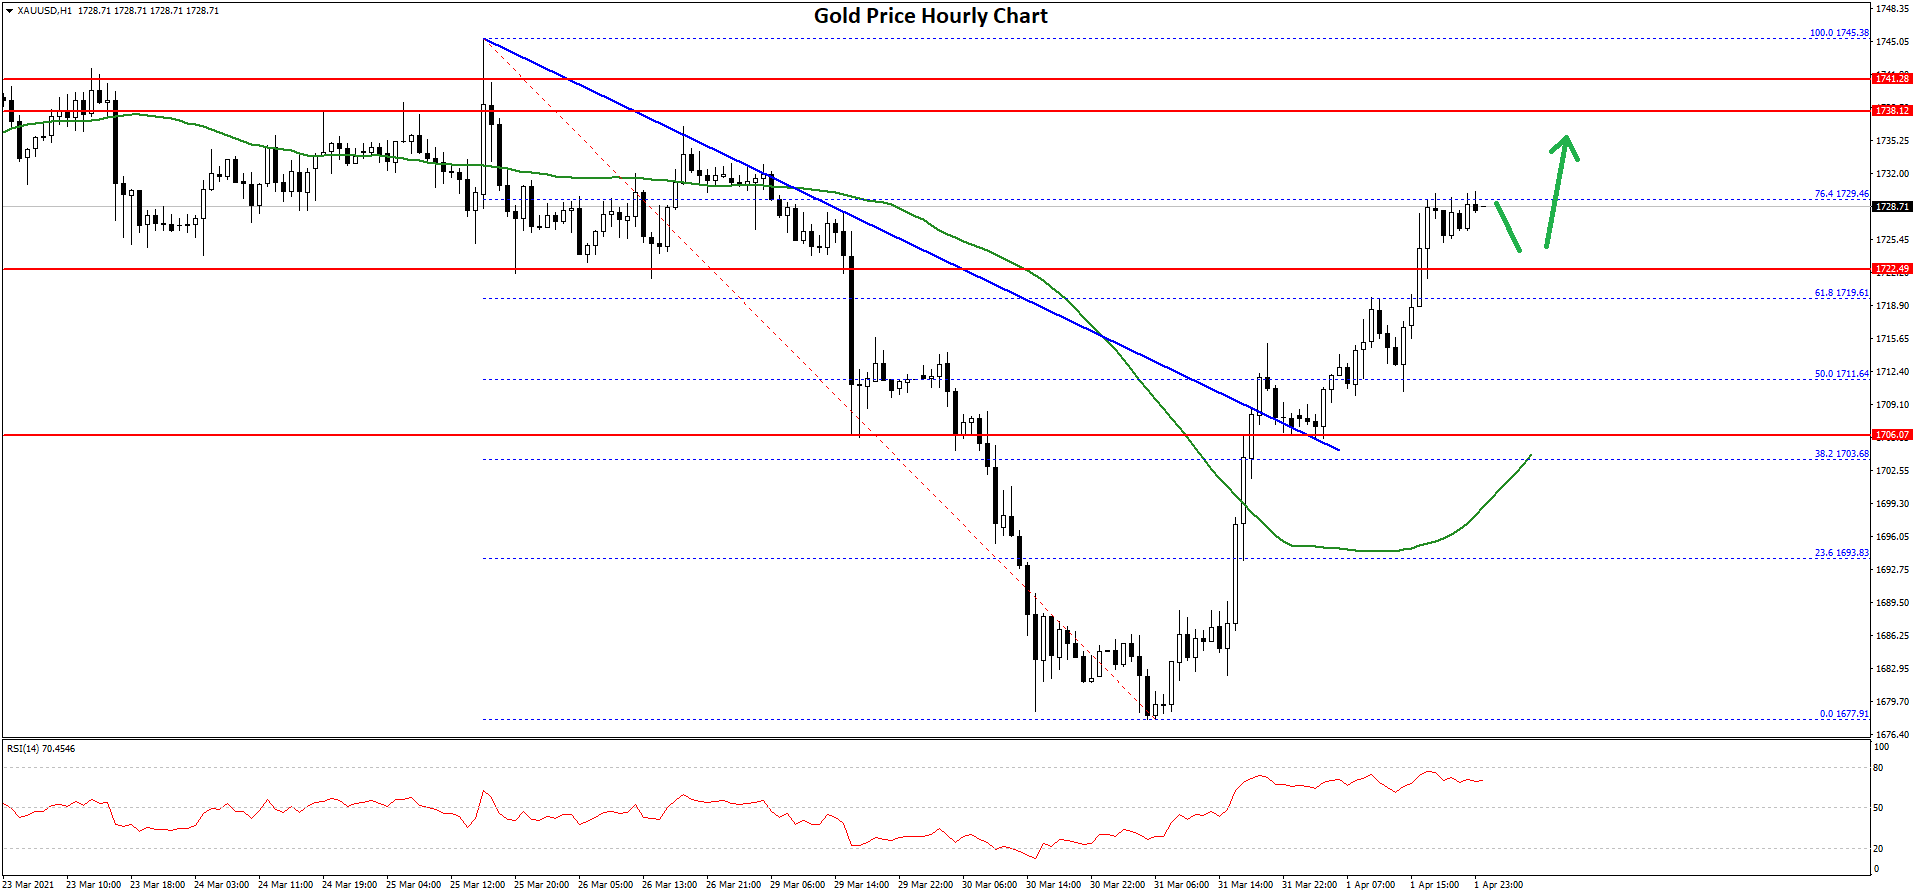
There was also a break above a major bearish trend line with resistance near $1,708 on the hourly chart of gold. The price is now trading well above $1,710 and the 50 hourly simple moving average.
It is now testing the 76.4% Fib retracement level of the downward move from the $1,745 swing high to $1,677 low. A successful break above the $1,730 resistance could open the doors for a larger increase in the coming sessions.
The next key resistance is near the $1,745 level. The main resistance is still near $1,750, above which the price could test $1,780. Conversely, the price could fail to continue higher and it might decline below the $1,720 level.
The main support is near the $1,705 level. A clear break below the $1,705 support may possibly start a strong decline towards $1,675 in the near term.
Oil Price Technical Analysis
Crude oil price remained well bid above the $57.50 support level against the US Dollar. The price gained pace and recently settled nicely above the $59.00 level.
The recent swing low was formed near $58.88 before there was a fresh increase. The price cleared the main $60.00 resistance zone and the 50 hourly simple moving average. There was also a break above a key bearish trend line with resistance near $60.55 on the hourly chart of XTI/USD.
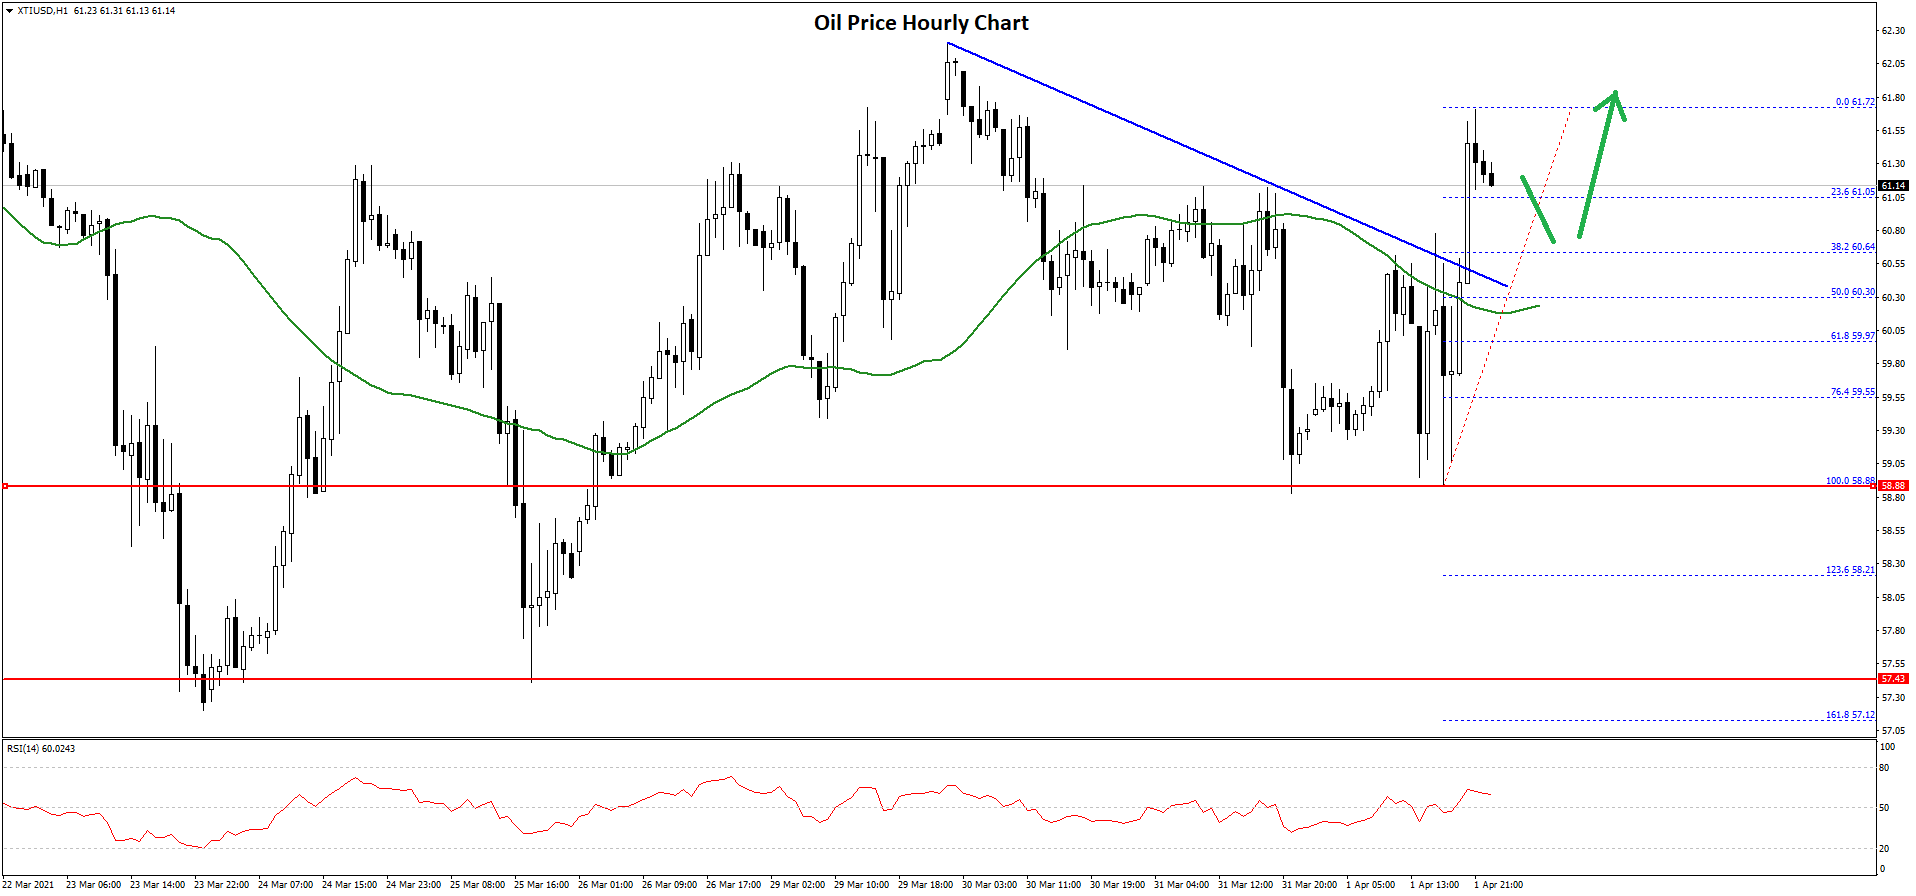
The price traded as high as $61.72 and it is currently correcting lower. An initial support is near the 23.6% Fib retracement level of the recent wave from the $58.88 low to $61.72 high at $61.05.
The first major support is near the broken trend line at $60.30 and the 50 hourly simple moving average. It is close to the 50% Fib retracement level of the recent wave from the $58.88 low to $61.72 high.
Any more losses might call for a test of the $60.00 support zone. Conversely, the price might resume its rise above the $61.75 and $62.00 levels. If there is an upside break above $62.00, the price could rally towards the $62.80 and $63.00 levels. The next major resistance is near the $63.45 level.
Trade over 50 forex markets 24 hours a day with FXOpen. Take advantage of low commissions, deep liquidity, and spreads from 0.0 pips. Open your FXOpen account now or learn more about trading forex with FXOpen.
This article represents the opinion of the Companies operating under the FXOpen brand only. It is not to be construed as an offer, solicitation, or recommendation with respect to products and services provided by the Companies operating under the FXOpen brand, nor is it to be considered financial advice.
Latest from Forex Analysis
Latest articles

How to Identify and Trade Liquidity Grabs
Understanding the intricacies of market liquidity and the role of liquidity grabs can be crucial for optimising trading strategies. Liquidity grabs, creating rapid price movements, are a key component of Smart Money trading. This article explores how to identify these

What Is a Piercing Line Pattern, and How Can You Trade with It?
In the world of technical analysis, the piercing line pattern stands out as a solid indicator of potential market reversals. This article delves into the nuances of this two-candlestick pattern, exploring its formation, significance, and how traders can effectively leverage

London Calling! FTSE 100 Stocks Flying High Once Again
Back in 2021, which when looking at a physical calendar does not seem such a long time ago yet feels like an epoch ago when considering the changes in global economies and the capital markets since then, the FTSE 100