


FXOpen

Gold price started a fresh increase after testing the $1,680 support zone. Crude oil price is trading nicely above $60.00 and it might continue to rise steadily.
Important Takeaways for Gold and Oil
- Gold price remained well bid near the $1,680 and $1,675 levels against the US Dollar.
- There was a break above a major bearish trend line with resistance near $1,708 on the hourly chart of gold.
- Crude oil price is holding the key $59.50 and $60.00 support levels.
- There was a break above a key bearish trend line with resistance near $60.55 on the hourly chart of XTI/USD.
Gold Price Technical Analysis
Earlier this week, gold price extended its decline below the $1,710 and $1,700 support levels against the US Dollar. However, the bulls were active near the $1,680 and $1,675 levels.
A low was formed near $1,677 on FXOpen before the price started a fresh increase. There was a break above the $1,695 and $1,700 resistance levels. The price climbed nicely above the 50% Fib retracement level of the downward move from the $1,745 swing high to $1,677 low.
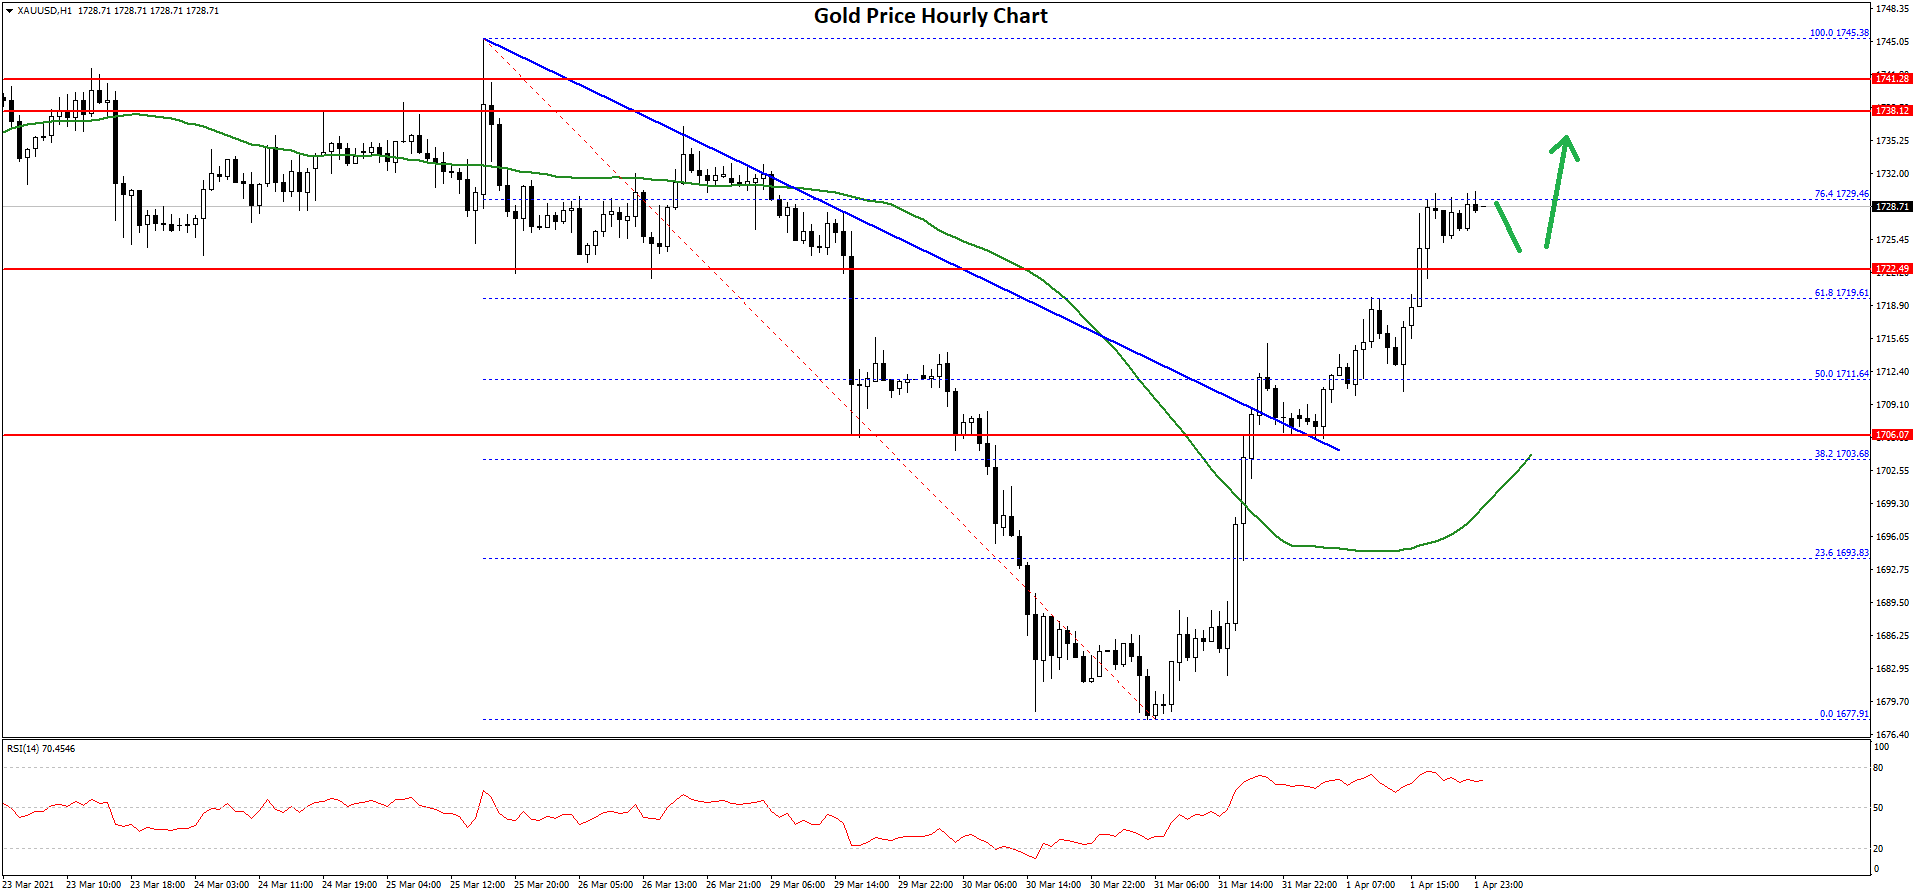
There was also a break above a major bearish trend line with resistance near $1,708 on the hourly chart of gold. The price is now trading well above $1,710 and the 50 hourly simple moving average.
It is now testing the 76.4% Fib retracement level of the downward move from the $1,745 swing high to $1,677 low. A successful break above the $1,730 resistance could open the doors for a larger increase in the coming sessions.
The next key resistance is near the $1,745 level. The main resistance is still near $1,750, above which the price could test $1,780. Conversely, the price could fail to continue higher and it might decline below the $1,720 level.
The main support is near the $1,705 level. A clear break below the $1,705 support may possibly start a strong decline towards $1,675 in the near term.
Oil Price Technical Analysis
Crude oil price remained well bid above the $57.50 support level against the US Dollar. The price gained pace and recently settled nicely above the $59.00 level.
The recent swing low was formed near $58.88 before there was a fresh increase. The price cleared the main $60.00 resistance zone and the 50 hourly simple moving average. There was also a break above a key bearish trend line with resistance near $60.55 on the hourly chart of XTI/USD.
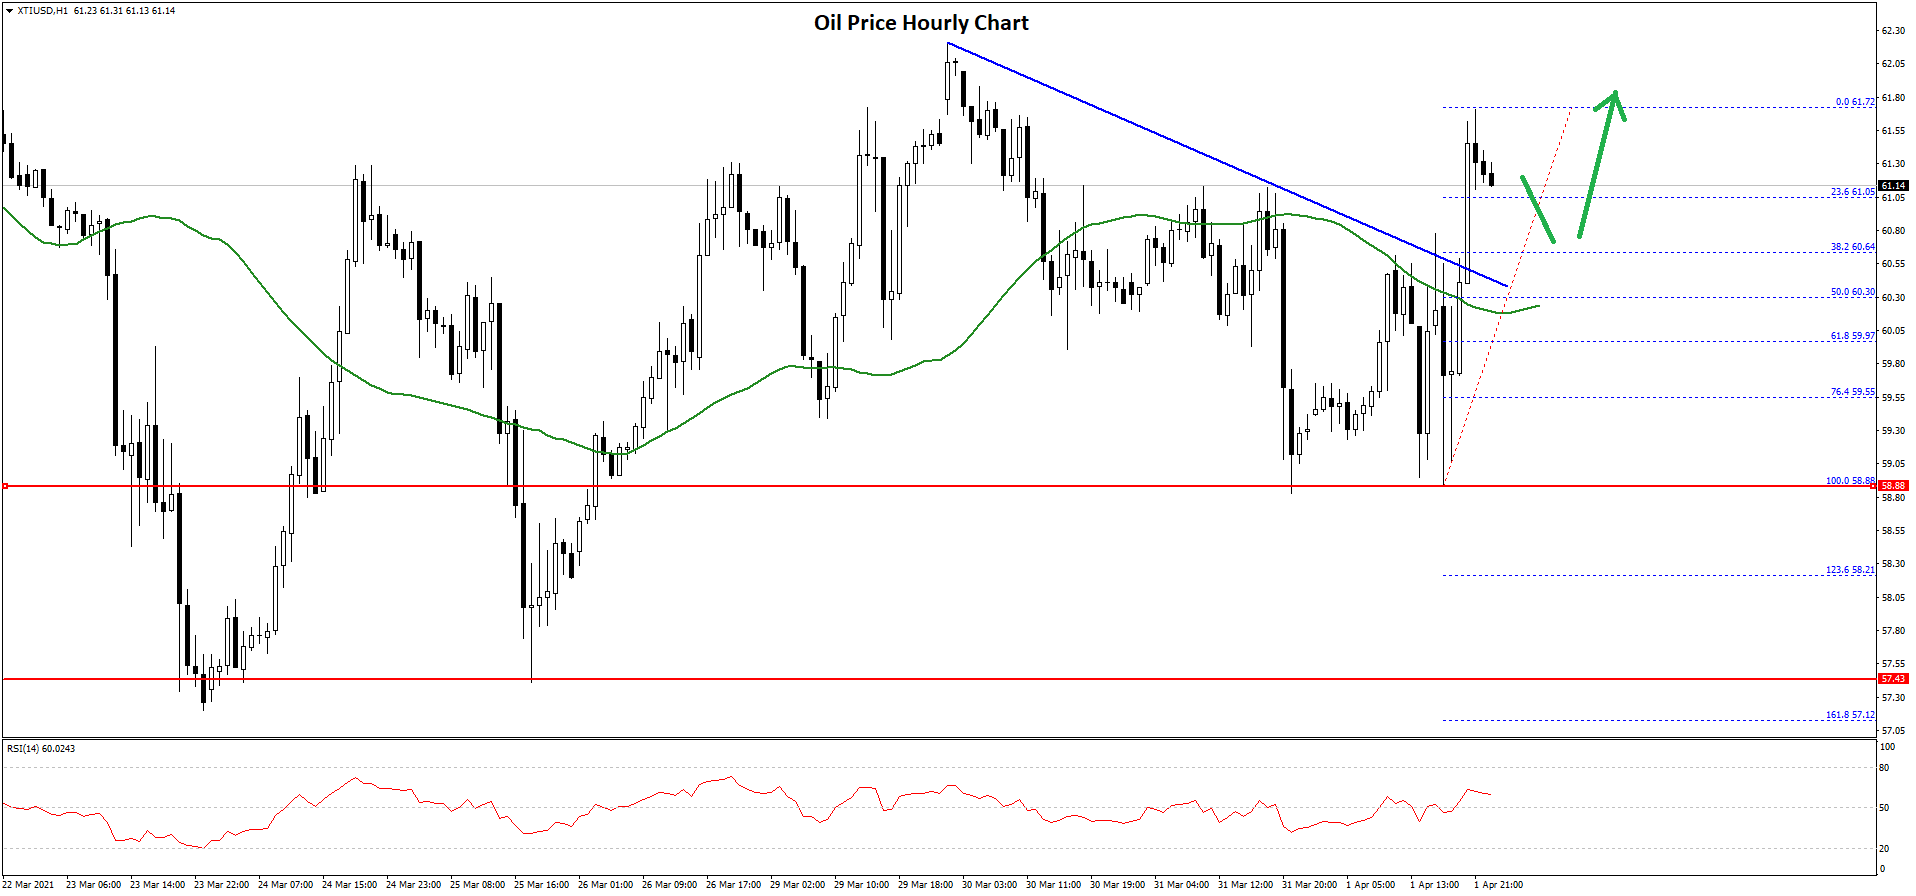
The price traded as high as $61.72 and it is currently correcting lower. An initial support is near the 23.6% Fib retracement level of the recent wave from the $58.88 low to $61.72 high at $61.05.
The first major support is near the broken trend line at $60.30 and the 50 hourly simple moving average. It is close to the 50% Fib retracement level of the recent wave from the $58.88 low to $61.72 high.
Any more losses might call for a test of the $60.00 support zone. Conversely, the price might resume its rise above the $61.75 and $62.00 levels. If there is an upside break above $62.00, the price could rally towards the $62.80 and $63.00 levels. The next major resistance is near the $63.45 level.
Trade over 50 forex markets 24 hours a day with FXOpen. Take advantage of low commissions, deep liquidity, and spreads from 0.0 pips. Open your FXOpen account now or learn more about trading forex with FXOpen.
This article represents the opinion of the Companies operating under the FXOpen brand only. It is not to be construed as an offer, solicitation, or recommendation with respect to products and services provided by the Companies operating under the FXOpen brand, nor is it to be considered financial advice.
Latest from Forex Analysis
Latest articles

What Is the VIX Index, and How Is It Used in Trading?
The VIX Index serves as a key indicator of expected market volatility over the next 30 days, derived directly from S&P 500 options. Developed by the Chicago Board Options Exchange in 1993, it offers a simple way to

The Stock Price of PepsiСo (PEP) Is Retracting from Its Yearly High
On April 23, the quarterly report of PepsiCo's performance for the first quarter was published, which was awaited anxiously.
The issue stemmed from the fact that in December 2023, the U.S. Food and Drug Administration (FDA) announced the recall

The S&P 500 Index Has Reached a Significant Resistance Level
Analyzing the S&P 500 chart (US SPX 500 mini on FXOpen) on April 26, we wrote about how the April decline could be a correction to the lower boundary of the channel within the 2024 rally. Following this,