


FXOpen

Gold price is facing a strong resistance near the $1,950 and $1,960 levels. Crude oil price is currently declining and it may perhaps continue lower below $37.00.
Important Takeaways for Gold and Oil
- Gold price started a decent recovery from $1,910, but struggled near $1,960 against the US Dollar.
- There is a key rising channel forming with support near $1,938 on the hourly chart of gold.
- Crude oil price is currently sliding and it is trading below the $40.00 support zone.
- There is a major bearish trend line forming with resistance near $37.70 on the hourly chart of XTI/USD.
Gold Price Technical Analysis
After a strong decline, gold price found support near the $1,910 level against the US Dollar. The price started a fresh increase above the $1,925 and $1,935 resistance levels.
It even broke the $1,950 resistance level and the 50 hourly simple moving average. However, the bears defended the $1,960 resistance area. A high is formed near $1,966 on FXOpen and the price is currently declining.
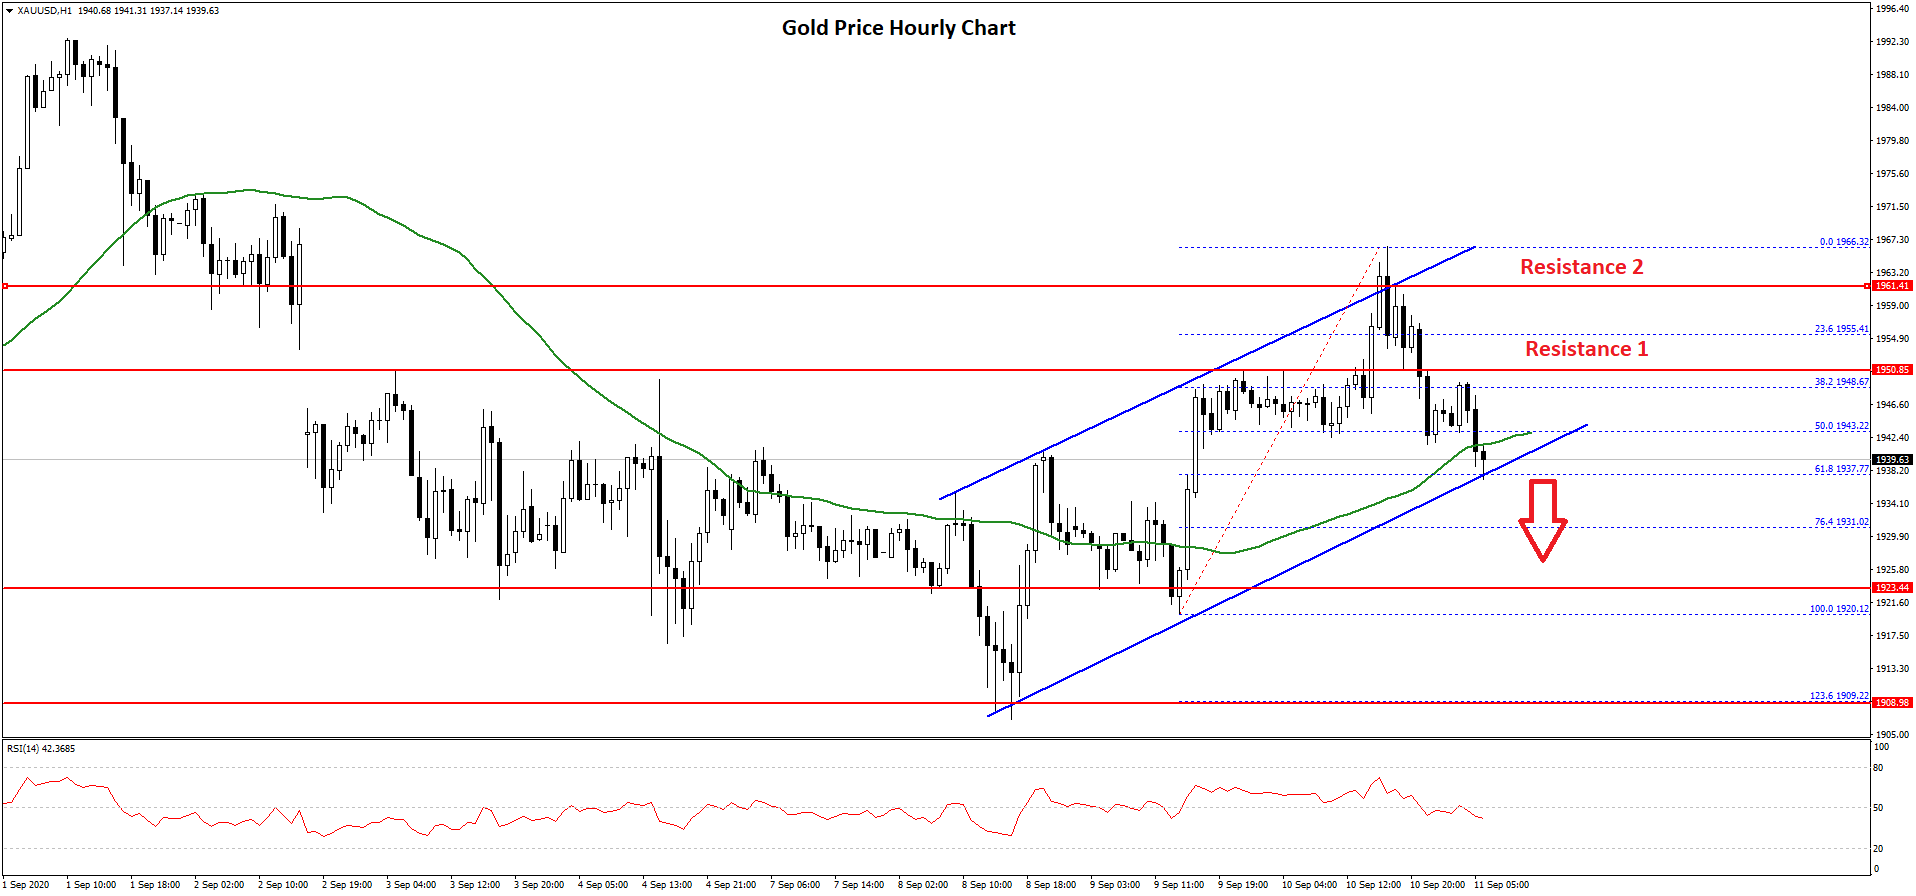
There was a break below the $1,950 support level. The price even traded below the 50% Fib retracement level of the upward move from the $1,920 swing low to $1,966 swing high.
The price is now testing the $1,938 support level, and the 61.8% Fib retracement level of the upward move from the $1,920 swing low to $1,966 swing high. There is also a key rising channel forming with support near $1,938 on the hourly chart of gold.
If there is a downside break below the channel support at $1,938, there is a risk of more losses. The next major support is near the $1,925 level, below which the price is likely to revisit the $1,910 support zone.
On the upside, the price is facing a major resistance near $1,950 and $1,960. A close above the $1,960 resistance zone could open the doors for a larger upward move towards the $1,980 and $1,985 resistance levels in the near term.
Oil Price Technical Analysis
Crude oil price started a nasty decline from well above the $42.00 support against the US Dollar. The price even broke the $40.00 support zone to move into a negative zone.
The decline gained pace below the $39.00 support and the 50 hourly simple moving average. It traded as low as $36.41 and recently started an upside correction. There was a break above the $38.00 resistance level.

The price even climbed above the 50% Fib retracement level of the recent decline from the $39.68 high to $36.41 low. However, the bears are defending the $38.50 and $38.70 levels.
There is also a major bearish trend line forming with resistance near $37.70 on the hourly chart of XTI/USD. The price also faced sellers near the 61.8% Fib retracement level of the recent decline from the $39.68 high to $36.41 low.
It is currently declining and trading below the $38.00 level. An initial support on the downside is near the $37.20 level. If there is a downside break below $37.20 and $37.00, there is a risk of more losses below the $35.00 support.
Conversely, oil price might break the trend line resistance and $38.00 to start a fresh recovery. However, the bulls need to push it above $40.00 to start a sustained upward move.
Trade over 50 forex markets 24 hours a day with FXOpen. Take advantage of low commissions, deep liquidity, and spreads from 0.0 pips. Open your FXOpen account now or learn more about trading forex with FXOpen.
This article represents the opinion of the Companies operating under the FXOpen brand only. It is not to be construed as an offer, solicitation, or recommendation with respect to products and services provided by the Companies operating under the FXOpen brand, nor is it to be considered financial advice.
Latest from Forex Analysis
Latest articles

What Order Imbalance Is and How To Use It in a Trading Strategy
Understanding the nuances of order imbalances is key for traders looking to navigate the ebb and flow of asset prices. Order imbalances provide a clear window into the supply and demand dynamics at play, offering strategic insights. This article delves

XAU/USD Gold Price Reaches an Important Resistance Zone
The XAU/USD gold chart today indicates that the historical record price of the metal is above USD 2,400 per ounce.
In addition to fears of a new round of inflation due to rising commodity prices, geopolitical tensions are

What Is a Break of Structure and How Can You Trade It?
In the ever-evolving world of Smart Money Concept (SMC) trading, a nuanced understanding of market dynamics is indispensable. This article explores the concept of Break of Structure (BOS), how to identify it, and its implications for trading strategies, setting traders