


FXOpen

Gold price traded above the $1,900 resistance zone before correcting lower. Crude oil price is rising and it is trading nicely above the $65.00 pivot level.
Important Takeaways for Gold and Oil
- Gold price gained pace above the $1,850 and $1,880 resistance levels against the US Dollar.
- There is a key contracting triangle forming with resistance near $1,898 on the hourly chart of gold.
- Crude oil price climbed higher and it cleared the $67.00 resistance zone.
- There is a major bullish trend line forming with support near $66.00 on the hourly chart of XTI/USD.
Gold Price Technical Analysis
This week, gold price started a steady increase above the $1,850 level against the US Dollar. It broke a few key hurdles near $1,880 to move further into a positive zone.
The price even settled above the $1,880 zone and the 50 hourly simple moving average. There was a clear break above the $1,900 level and a high was formed near $1,912 on FXOpen. The price is now correcting gains and trading below $1,900.

There was a break below $1,890, but downsides were limited. The price traded as low as $1,888 and the price is now consolidating. It seems like there is a key contracting triangle forming with resistance near $1,898 on the hourly chart of gold.
The triangle resistance is near the 38.2% Fib retracement level of the recent decline from the $1,912 high to $1,888 low. The main resistance is now forming near the $1,900 level and the 50 hourly simple moving average.
The 50% Fib retracement level of the recent decline from the $1,912 high to $1,888 low is also near the $1,900 zone. A clear break above the $1,900 level may possibly open the doors for a move towards the $1,920 level or even $1,935.
On the downside, the price is likely to find bids near $1,888. If there is a downside break below $1,888, there are chances of a move towards the $1,870 level in the near term.
Oil Price Technical Analysis
Crude oil price remained well supported above the $60.00 zone against the US Dollar. As a result, the price started a steady increase above the $63.50 resistance zone.
The price was able to surpass the $64.50 and $65.00 resistance levels. There was also a break above the $66.40 resistance and the 50 hourly simple moving average. A high is formed near $67.30 and the price is now consolidating gains.
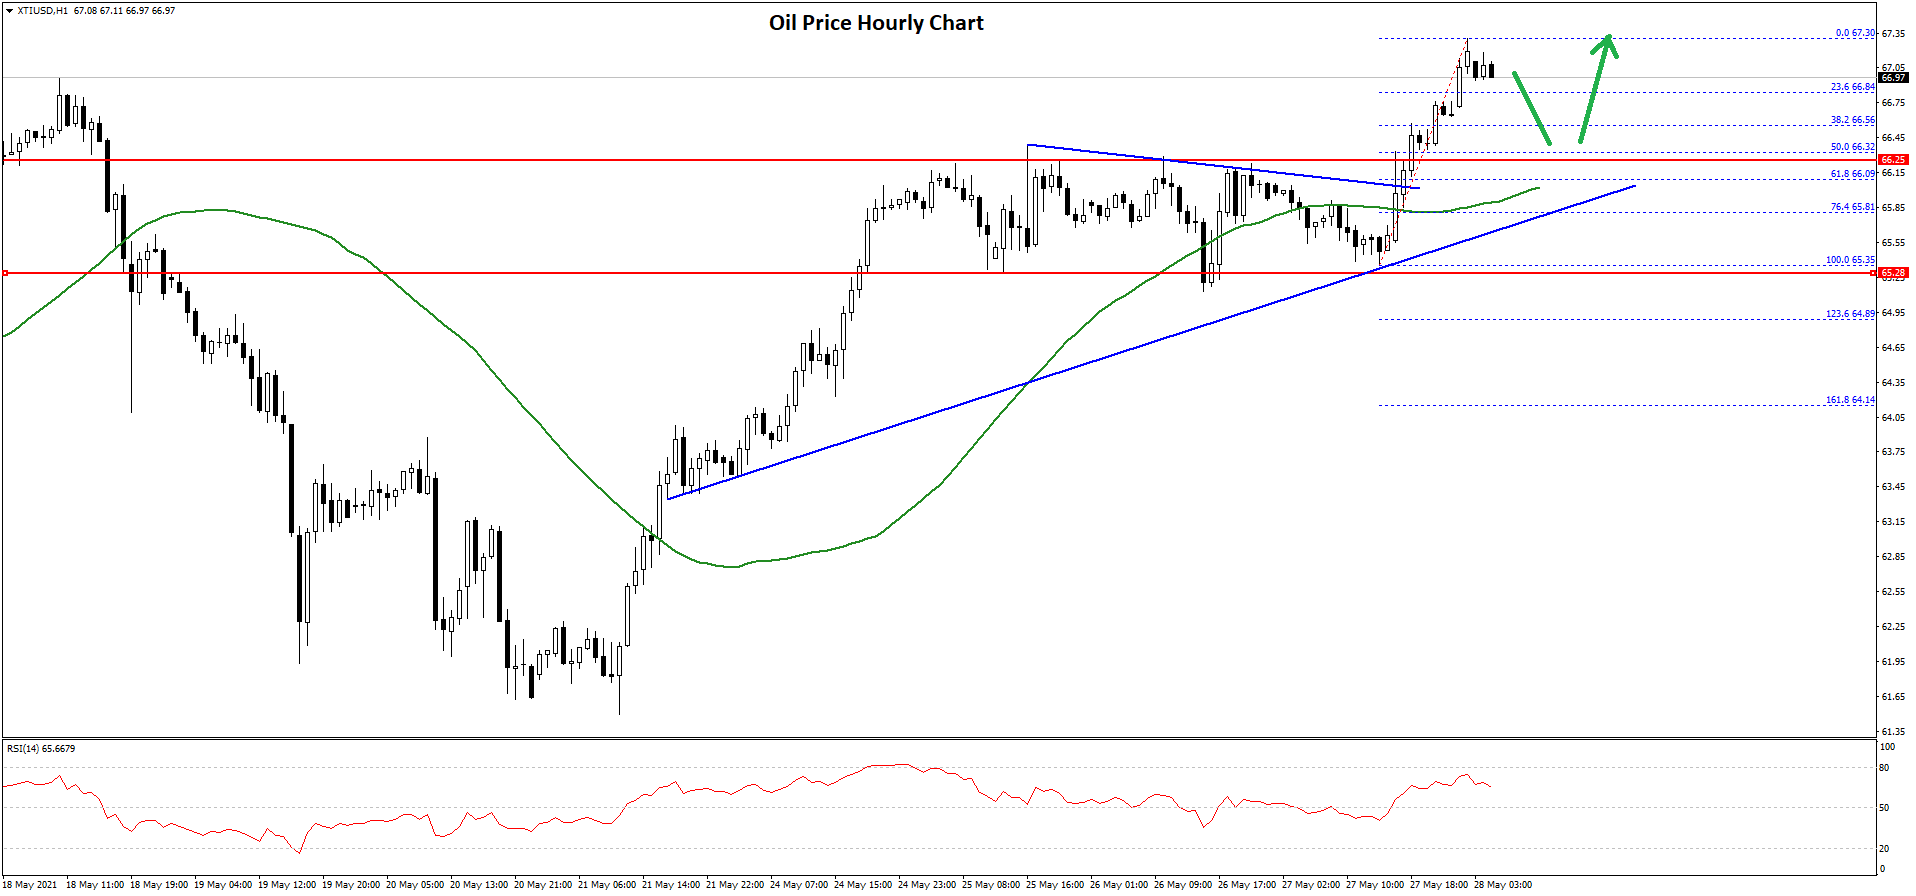
An initial support is near the $66.85 level. It is near the 23.6% Fib retracement level of the recent wave from the $65.35 low to $67.30 high.
The main support is now forming near the $66.30 level. It is near the 50% Fib retracement level of the recent wave from the $65.35 low to $67.30 high. There is also a major bullish trend line forming with support near $66.00 on the hourly chart of XTI/USD.
A downside break below the trend line could open the doors for a move towards the $65.30 support level. Any more losses may possibly lead the price towards the $64.80 support zone.
On the upside, the price is facing resistance near the $67.30 level. If there is an upside break above $67.30, the price could test $68.00. The next major resistance is near the $70.00 level.
This forecast represents FXOpen Markets Limited opinion only, it should not be construed as an offer, invitation or recommendation in respect to FXOpen Markets Limited products and services or as financial advice.
Trade over 50 forex markets 24 hours a day with FXOpen. Take advantage of low commissions, deep liquidity, and spreads from 0.0 pips. Open your FXOpen account now or learn more about trading forex with FXOpen.
This article represents the opinion of the Companies operating under the FXOpen brand only. It is not to be construed as an offer, solicitation, or recommendation with respect to products and services provided by the Companies operating under the FXOpen brand, nor is it to be considered financial advice.
Latest from Forex Analysis
Latest articles

Commodity Currencies at Strategic Levels. What Can Affect a Breakdown Downwards?
The decline in investor expectations regarding a change in the vector of the Fed's monetary policy contributes to the fall of not only European, but also commodity currencies. So, in recent weeks:
- AUD/USD has lost more than 200 points

Market Analysis: AUD/USD and NZD/USD Turn Red
AUD/USD declined below the 0.6500 and 0.6455 support levels. NZD/USD is also moving lower and might struggle to recover above 0.5950.
Important Takeaways for AUD/USD and NZD/USD Analysis Today
· The Aussie Dollar started

Since the Start of the Week, Brent Oil Price Has Dropped over 4%
At the beginning of the week, March 15, we wrote that the price of Brent oil could form a correction from the resistance level of USD 91 per barrel. Since then, the price has decreased by more than 4% due