


FXOpen

Gold price started a decent recovery and climbed above $1,720. Crude oil price traded to a new yearly high at $67.81 before correcting lower.
Important Takeaways for Gold and Oil
- Gold price found support near $1,680 and started a short-term recovery against the US Dollar.
- There was a break above a major bearish trend line at $1,700 on the hourly chart of gold.
- Crude oil price extended its rally and it traded to a new multi-month high near $67.81.
- Recently, there was a break below a connecting bullish trend line at $64.20 on the hourly chart of XTI/USD.
Gold Price Technical Analysis
Gold price formed a strong support base above the $1,680 level against the US Dollar. As a result, there was a decent recovery wave above the $1,700 and $1,705 resistance levels.
There was also a break above a major bearish trend line at $1,700 on the hourly chart of gold. It opened the doors for a move above the $1,720 level. The price even cleared the $1,730 level and settled above the 50 hourly simple moving average.
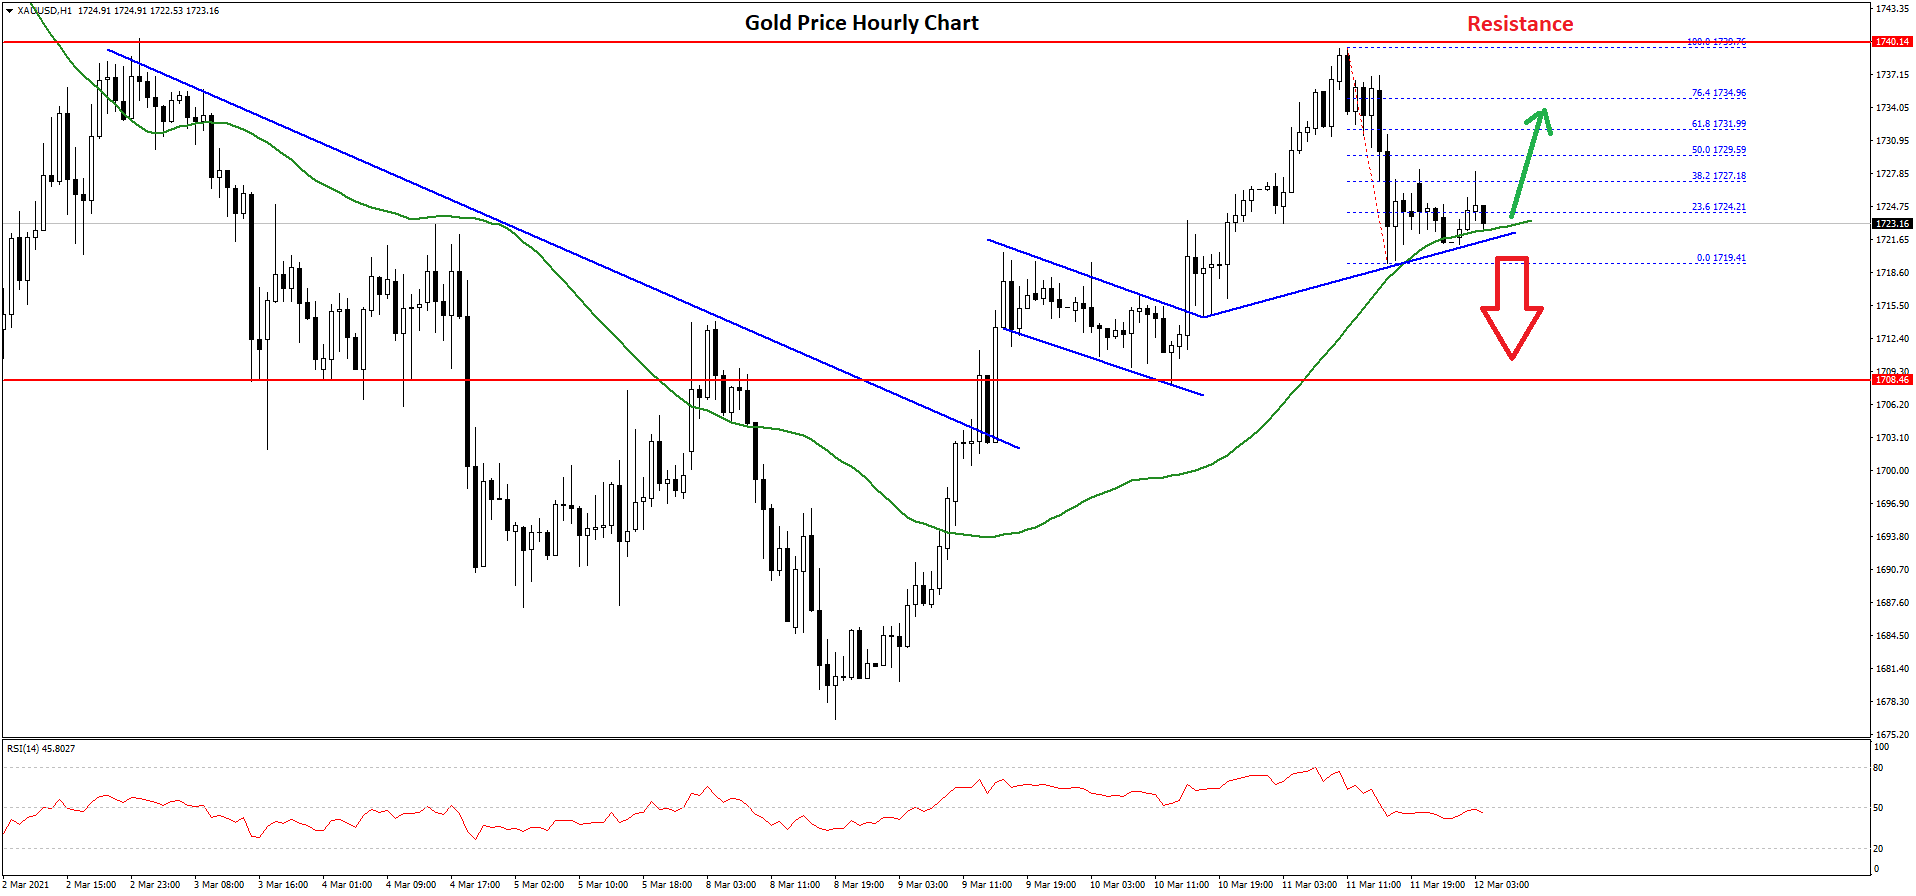
A high is formed near $1,740 on FXOpen and the price is currently correcting lower. There was a break below the $1,730 level. The price is now testing the $1,720 support and the 50 hourly simple moving average.
There is also a connecting bullish trend line with support near $1,721 on the same chart. If there is a downside break below $1,720, the price could revisit $1,700. Any more losses might call for a test of the $1,680 support.
On the upside, an initial resistance is near the $1,730 level. It is close to the 50% Fib retracement level of the recent decline from the $1,740 swing high to $1,719 low.
The first major resistance is near the $1,735 level. The 76.4% Fib retracement level of the recent decline from the $1,740 swing high to $1,719 low is also near $1,735. A convincing break above $1,730 and $1,735 might open the doors for a push above the $1,740 and $1,750 levels.
Oil Price Technical Analysis
Crude oil price remains in a strong uptrend and it extended its upward move above the $65.00 resistance zone against the US Dollar. The price even cleared the $66.50 resistance level to move further into a positive zone.
Finally, there was a break above the $67.00 level. The price traded to a new multi-month high near $67.81 before starting a downside correction.
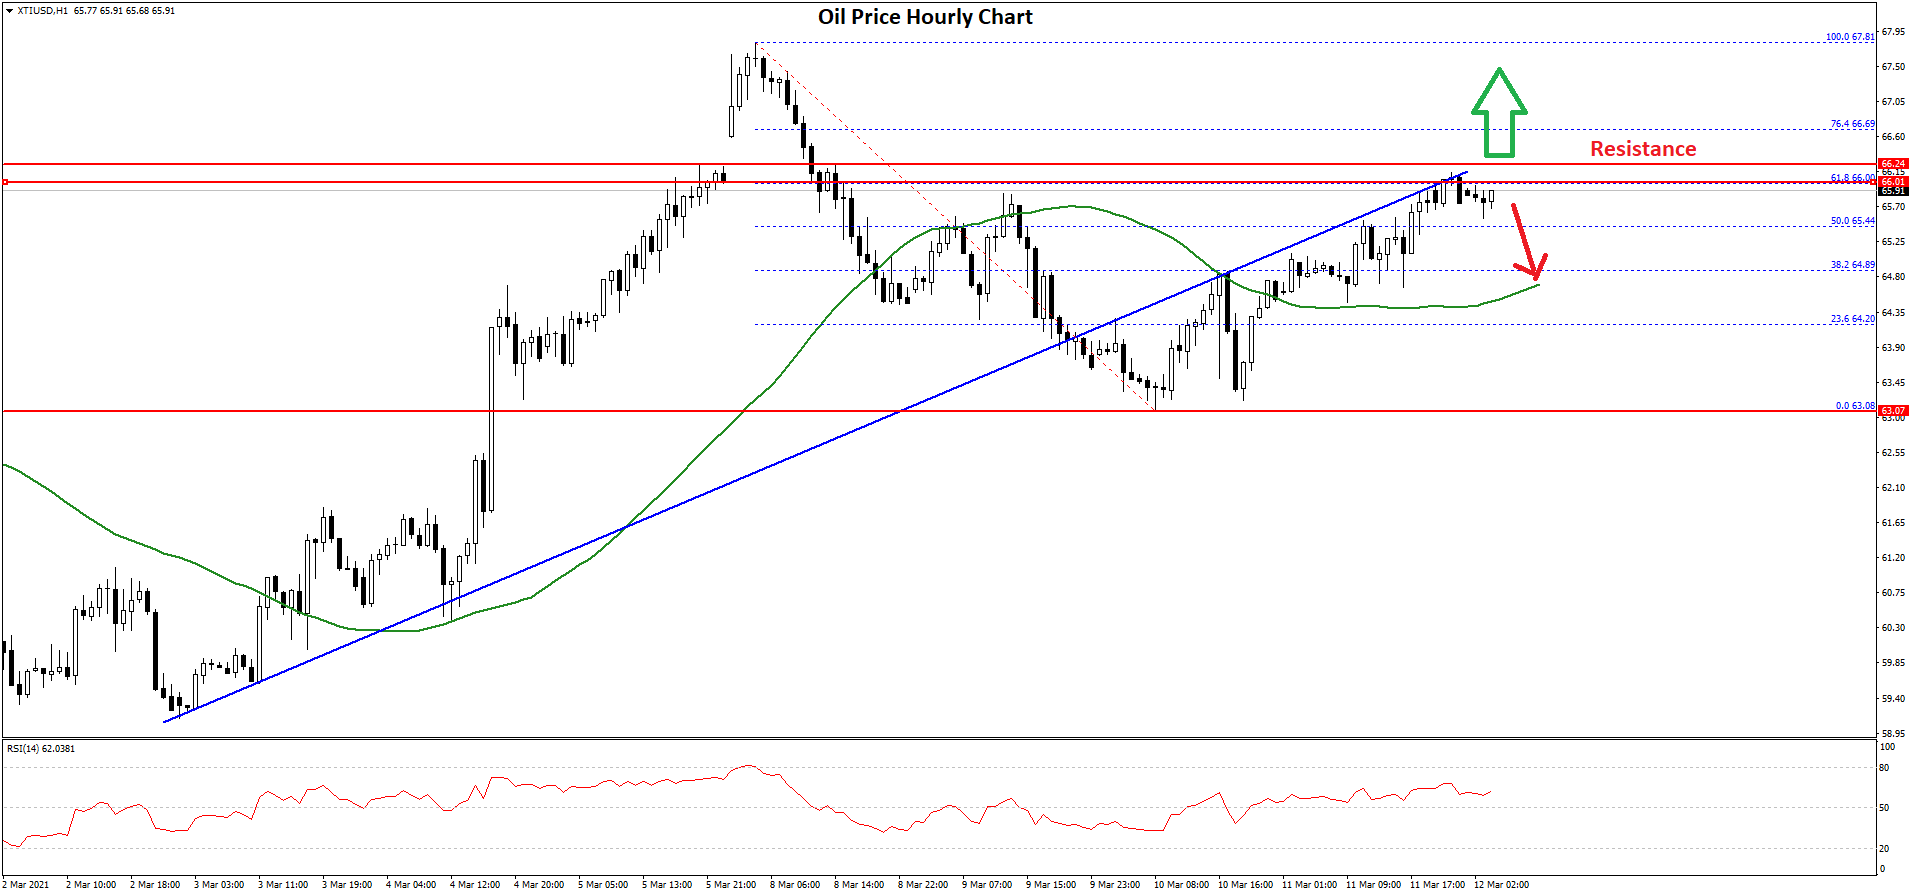
There was a break below the $66.50 and $66.00 support levels. There was also a break below a connecting bullish trend line at $64.20 on the hourly chart of XTI/USD. The price traded as low as $63.08 and it is currently recovering.
There was a break above the 50% Fib retracement level of the recent decline from the $67.81 high to $63.08 low. However, the price seems to be facing resistance near $66.00 and the same broken trend line.
The 61.8% Fib retracement level of the recent decline from the $67.81 high to $63.08 low is also acting as a resistance. If there is an upside break above $66.00, the price could resume its increase towards $67.50 and $68.00.
If there are more downsides, the price could slide towards the $63.00 support. The next major support is near the $62.00 level.
Trade over 50 forex markets 24 hours a day with FXOpen. Take advantage of low commissions, deep liquidity, and spreads from 0.0 pips. Open your FXOpen account now or learn more about trading forex with FXOpen.
This article represents the opinion of the Companies operating under the FXOpen brand only. It is not to be construed as an offer, solicitation, or recommendation with respect to products and services provided by the Companies operating under the FXOpen brand, nor is it to be considered financial advice.
Latest from Forex Analysis
Latest articles

Moderna goes AI and experiences share price rally
It has been a few years now since the word Moderna was heard, or read, several times per day and as with many periods of time in which a previously headline-dominating phenomenon subsides, the pharmaceutical giant's seemingly continuous media coverage

USD to CAD Analytical Predictions in 2024, 2025 and Beyond
This comprehensive article delves into the intricacies of the USD to CAD exchange rate, exploring the factors that may influence its trajectory in 2024, 2025, and beyond. From economic outlooks to key market drivers, this article provides valuable insights for

France Joins European Stock Boom as CAC 40 Index Heads for Highs
This decade has been full of market-disrupting surprises, placing it as completely different to any other decade experienced by residents of Western Europe and North America since the end of the Second World War.
The only constant dynamic since the