


FXOpen

Gold price started a fresh upward move from the $1,460 support and climbed above $1,480. On the other hand, crude oil price is currently under pressure and recently broke the $55.00 support.
Important Takeaways for Gold and Oil
- Gold price is currently climbing and is trading above the $1,500 resistance area against the US Dollar.
- There is a major bullish trend line forming with support near $1,505 on the hourly chart of gold.
- Crude oil price is currently under pressure and it recently broke the $54.00 support area.
- There is a crucial bearish trend line forming with resistance near $53.20 on the hourly chart of XTI/USD.
Gold Price Technical Analysis
Recently, gold price tested the $1,460 support area and started a fresh increase against the US Dollar. A swing low was formed near $1,459 and the price climbed above the $1,465 and $1,480 resistance levels.
The upward move gained pace once the price broke the $1,480 resistance and the 50 hourly simple moving average. Moreover, there was a break above the 61.8% Fib retracement level of the last decline from the $1,536 high to $1,459 low.
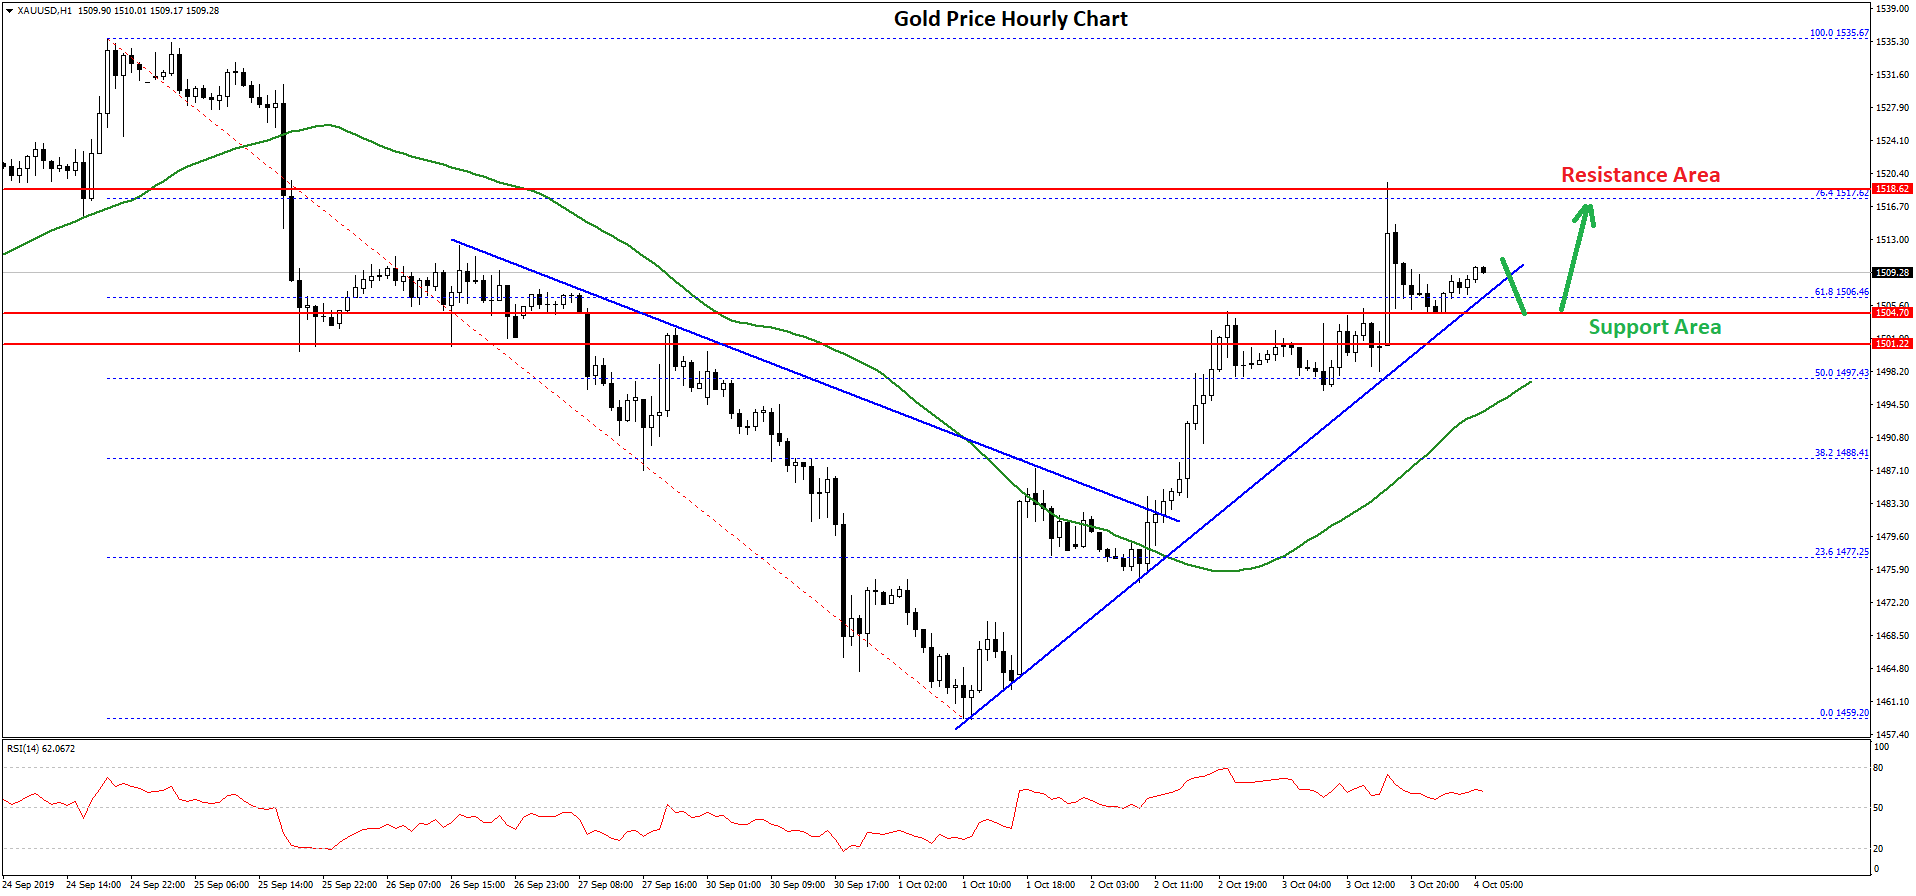
Moreover, the price broke the $1,500 resistance area on FXOpen and even climbed above the $1,510 level. It tested the $1,520 resistance area, where sellers took a stand.
It seems like the 76.4% Fib retracement level of the last decline from the $1,536 high to $1,459 low acted as a key resistance. At the moment, the price is trading just above the $1,505 and $1,500 support levels.
There is also a major bullish trend line forming with support near $1,505 on the hourly chart of gold. If there is a downside break below the trend line support, the price could test the $1,500 support area.
Any further losses might push the price towards the $1,480 support area. On the upside, the main resistance area is near the $1,520 level. A clear break above the $1,520 resistance could push the price towards the $1,535 and $1,540 levels.
Oil Price Technical Analysis
This week, crude oil price followed a bearish path and settled below the $55.00 support area against the US Dollar. The price even gained pace below the $55.00 support and traded below the $54.00 support.
Moreover, there was a close below the $54.00 support and the 50 hourly simple moving average. It even traded below the $52.50 support and a low was formed recently near $52.07.
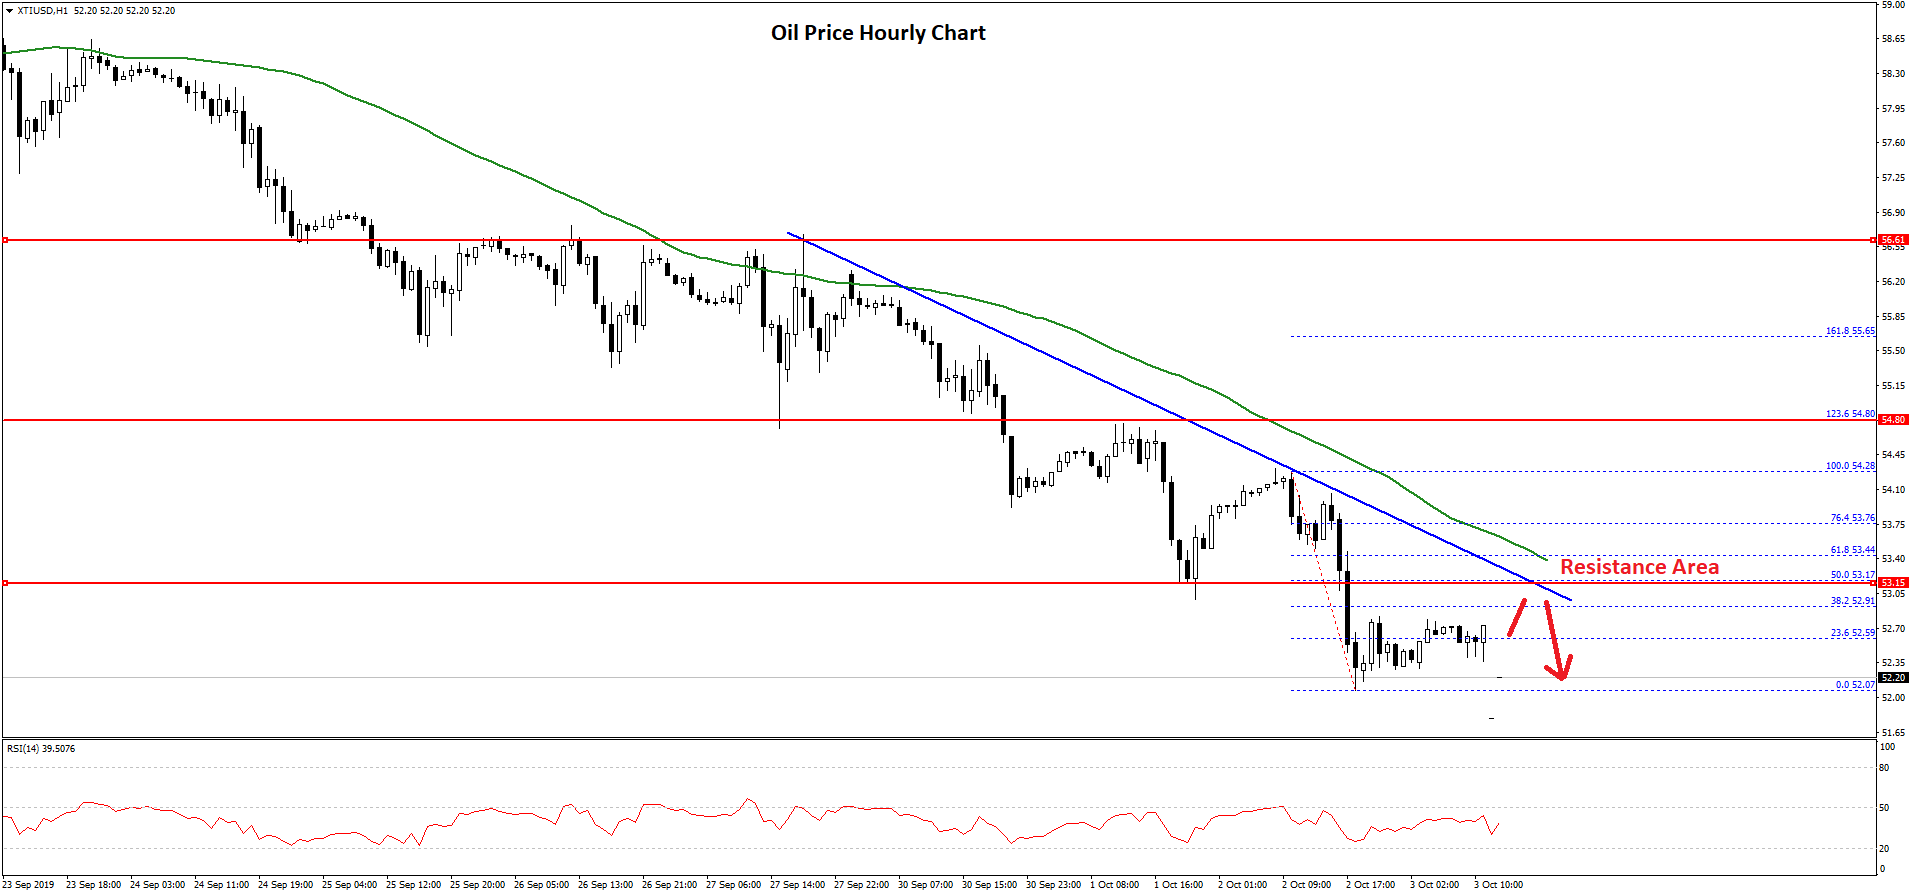
At the moment, the price is consolidating losses above the $52.00 support. An immediate resistance is near the $53.00 level, plus the 38.2% Fib retracement level of the recent decline from the $54.28 high to $52.07 low.
The main resistance is near the $53.20 and $53.50 levels. Additionally, there is a crucial bearish trend line forming with resistance near $53.20 on the hourly chart of XTI/USD.
The trend line coincides with the 50% Fib retracement level of the recent decline from the $54.28 high to $52.07 low. Therefore, an upside break above the $53.20 and $53.50 levels is must for decent recovery in oil price in the near term.
Conversely, a downside break below the $52.00 support might spark more losses. The next key support below $52.00 is near the $50.20 and $50.00 levels.
Trade over 50 forex markets 24 hours a day with FXOpen. Take advantage of low commissions, deep liquidity, and spreads from 0.0 pips. Open your FXOpen account now or learn more about trading forex with FXOpen.
This article represents the opinion of the Companies operating under the FXOpen brand only. It is not to be construed as an offer, solicitation, or recommendation with respect to products and services provided by the Companies operating under the FXOpen brand, nor is it to be considered financial advice.
Latest from Forex Analysis
Latest articles

Anchored VWAP and How You Can Use It in Forex Trading
In the world of forex trading, understanding the nuanced tools at your disposal can significantly enhance decision-making processes. One such sophisticated tool is the Anchored Volume-Weighted Average Price (Anchored VWAP), which refines the standard VWAP by allowing traders to set

META Share Price Collapses after Publication of Quarterly Report
Just yesterday, META's stock price closed at USD 493.50, up approximately 40% since the start of 2024 and up nearly 300% since the start of 2023.
However, following the release of Meta's quarterly report, its shares plummeted to USD

USD/JPY Analysis: The Rate Exceeds The Level of 155 Yen Per US Dollar
Today, the price of USD/JPY once again renewed its 34-year high, exceeding the level of 155 yen per dollar, which put pressure on the current authorities.
According to Reuters, officials are trying to maintain calm in the market.
"We