


FXOpen

Gold price is failed to continue above $1,550 and $1,555, and recently started a downside correction. Crude oil price is currently rising and it could climb above $57.00.
Important Takeaways for Gold and Oil
- Gold price is currently correcting lower below the $1,540 support area against the US Dollar.
- There was a break below a major bullish trend line with support near $1,535 on the hourly chart of gold.
- Crude oil price is showing a few positive signs and it could climb above the $57.00 resistance.
- There is a key bullish trend line forming with support near $55.00 on the hourly chart of XTI/USD.
Gold Price Technical Analysis
Earlier this week, gold price climbed above the $1,535 and $1,540 resistance levels against the US Dollar. The price even broke the $1,550 resistance level and traded to a new yearly high at $1,555.
However, the price struggled to gain momentum above the $1,550 and $1,555 resistance levels. The last swing high was formed near $1,550 on FXOpen and the price started a fresh downside correction.
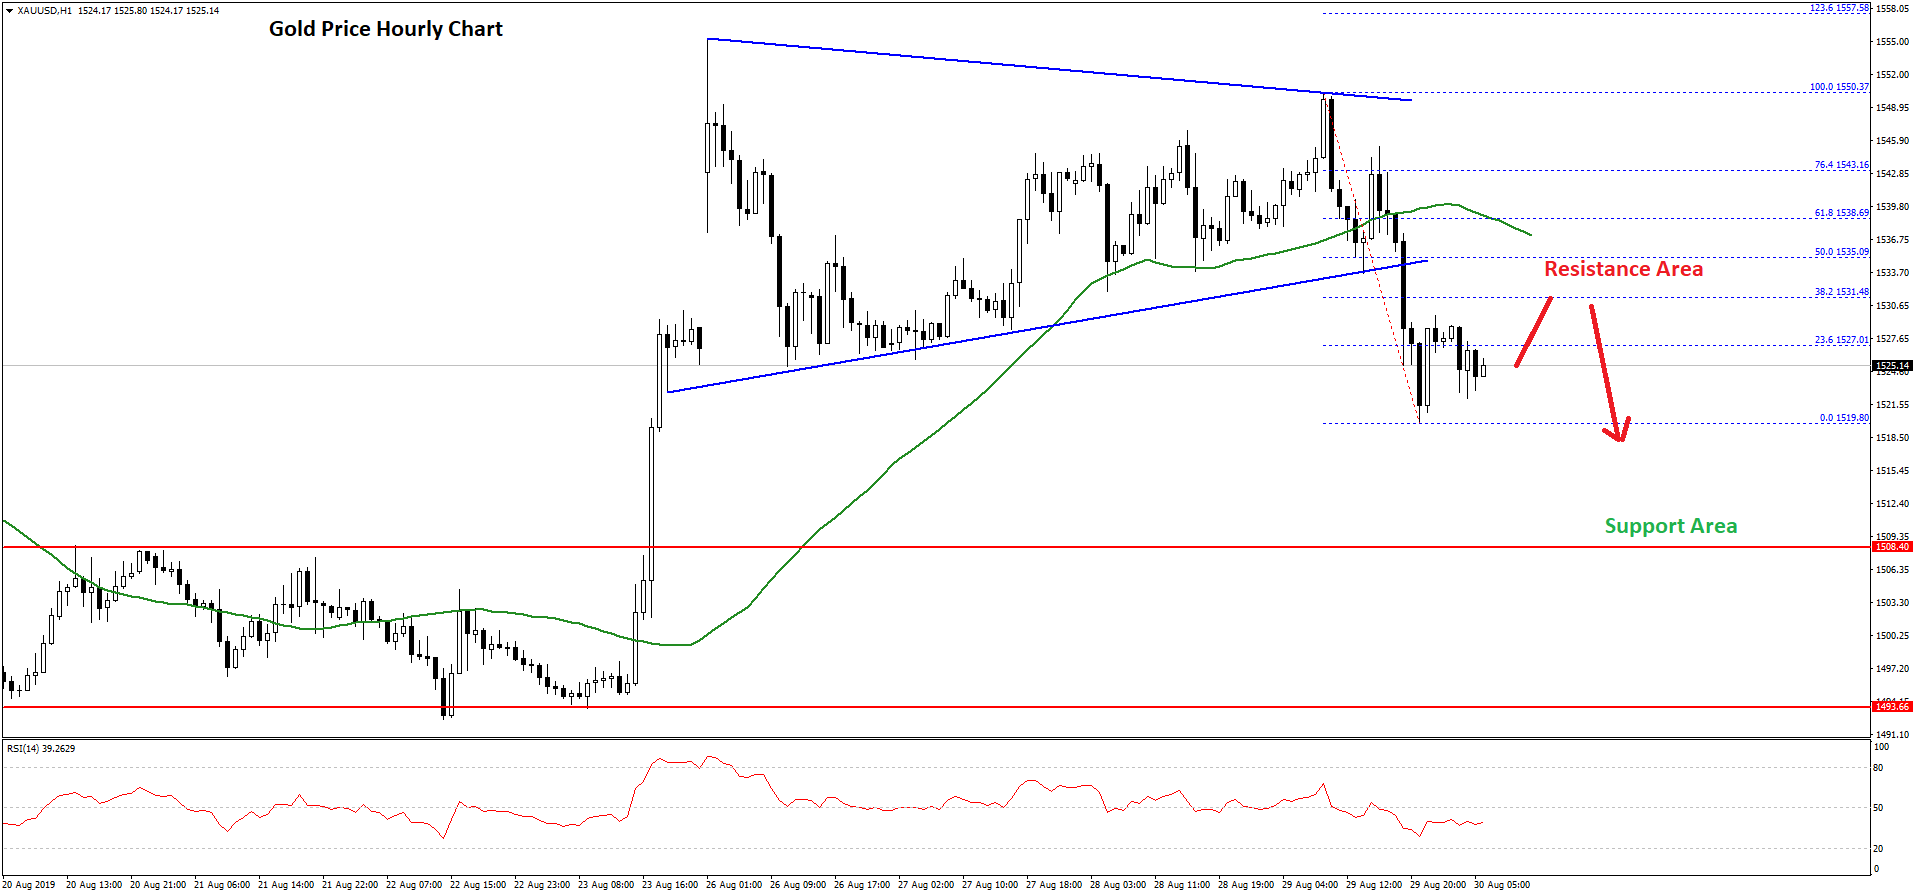
The price broke the $1,540 support and the 50 hourly simple moving average. Moreover, there was a break below a major bullish trend line with support near $1,535 on the hourly chart of gold. The price even broke the $1,525 support level.
The recent low was formed near $1,519 and the price is currently correcting higher. It tested the 23.6% Fib retracement level of the recent decline from the $1,550 high to $1,519 low.
However, there are many hurdles on the upside near the $1,535 and $1,540 levels. Moreover, the 50% Fib retracement level of the recent decline from the $1,550 high to $1,519 low is positioned near the $1,535 level to act as a resistance.
Therefore, if the price corrects higher, it could struggle near the $1,535 and $1,540 resistance levels. On the downside, an immediate support is near the $1,520 level. If there is a downside break below the $1,520 support area, the price could decline further towards the $1,505 and $1,500 support levels.
Oil Price Technical Analysis
There was a strong support formed near $53.20 in crude oil price against the US Dollar. The price started a steady rise and climbed above the $54.00 and $55.00 resistance levels.
It opened the doors for more gains above the $55.50 resistance and the 50 hourly simple moving average. Finally, the price surged above $56.00 and traded to a new weekly high at $56.73.
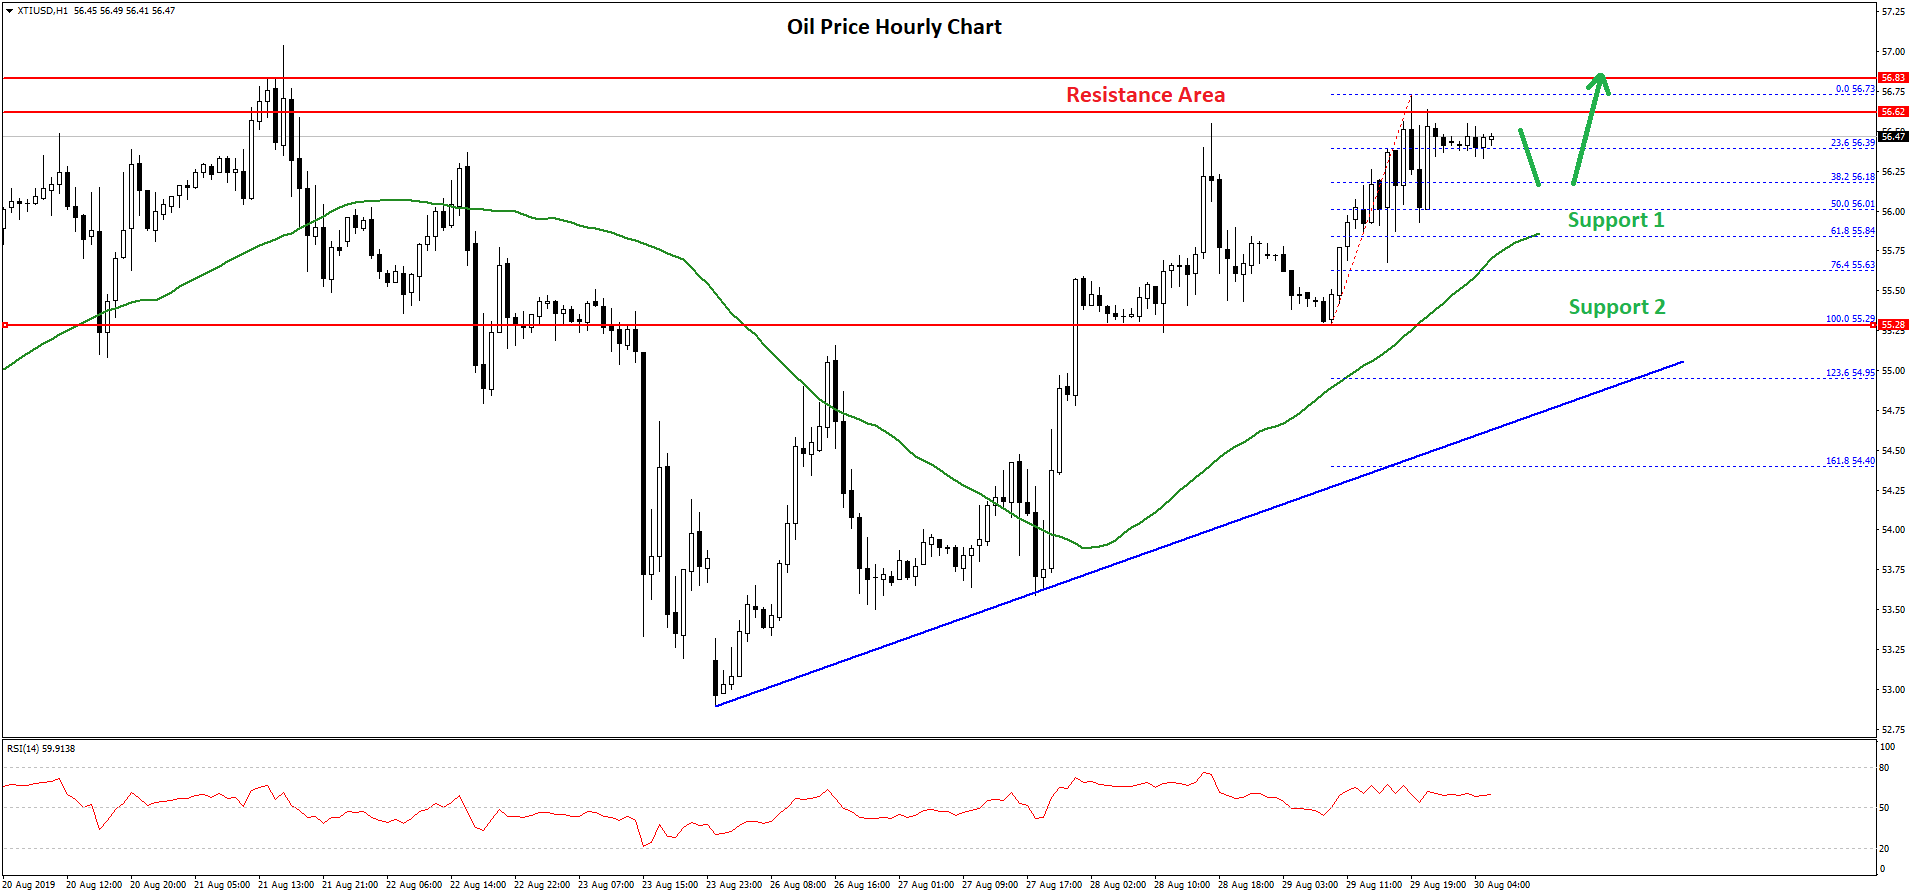
At the moment, the price is consolidating losses near the $56.40 level plus the 23.6% Fib retracement level of the recent wave from the $55.29 low to $56.73 high. On the downside, there are many supports near the $56.20 and $56.00 levels.
The 50% Fib retracement level of the recent wave from the $55.29 low to $56.73 high is also near the $56.00 level to act as a support. Moreover, there is a key bullish trend line forming with support near $55.00 on the hourly chart of XTI/USD.
An intermediate support is near the $55.80 level and the 50 hourly simple moving average. Therefore, a downside correction from the current levels remain supported near $56.00 and $55.80.
On the upside, a clear break above the $57.00 resistance area is likely to open the doors for more gains towards the $58.00 and $58.40 resistance levels in the near term.
Trade over 50 forex markets 24 hours a day with FXOpen. Take advantage of low commissions, deep liquidity, and spreads from 0.0 pips. Open your FXOpen account now or learn more about trading forex with FXOpen.
This article represents the opinion of the Companies operating under the FXOpen brand only. It is not to be construed as an offer, solicitation, or recommendation with respect to products and services provided by the Companies operating under the FXOpen brand, nor is it to be considered financial advice.
Latest from Forex Analysis
Latest articles

Germany's DAX 40 Index Flying High Despite Pessimistic National Outlook
For a number of years now, there has been a lot of discourse over the current situation and the future of the German domestic economy.
From both inside Germany and globally, analysts, government officials, and corporate leaders have demonstrated a

Volatility in the Pound Is Rising, the Euro is Consolidating
GBP/USD
At the end of last week, the British currency fell sharply, testing a significant support level at 1.2300. The resumption of the downward trend for the pair became possible after some statements by British officials:
- On Wednesday,

The Price of Gold XAU/USD Shows Strongest Fall in Almost 2 Years
On Monday, the price of gold fell from USD 2,386 to USD 2,333 per ounce — this is the strongest drop in one day in almost 2 years, according to Bloomberg. On Tuesday morning in the Asian session, the