


FXOpen

Gold price started a decent recovery wave above the $1,820 resistance. Crude oil price is declining and it might even break the $70.00 support zone.
Important Takeaways for Gold and Oil
- Gold price started a fresh recovery wave after forming a base above $1,790 against the US Dollar.
- There is a key bullish trend line forming with support near $1,825 on the hourly chart of gold.
- Crude oil price failed to settle above $75.000 and it started a fresh decline.
- There was a break below a major bullish trend line with support near $74.55 on the hourly chart of XTI/USD.
Gold Price Technical Analysis
This week, gold price formed a decent support base above the $1,790 zone against the US Dollar. The price started a fresh upward move and it surpassed the $1,800 resistance zone.
The price even settled above the $1,810 level and the 50 hourly simple moving average. The price even broke the $1,820 resistance and it traded as high as $1,833 on FXOpen. Recently, there was a minor downside correction below the $1,830 level.
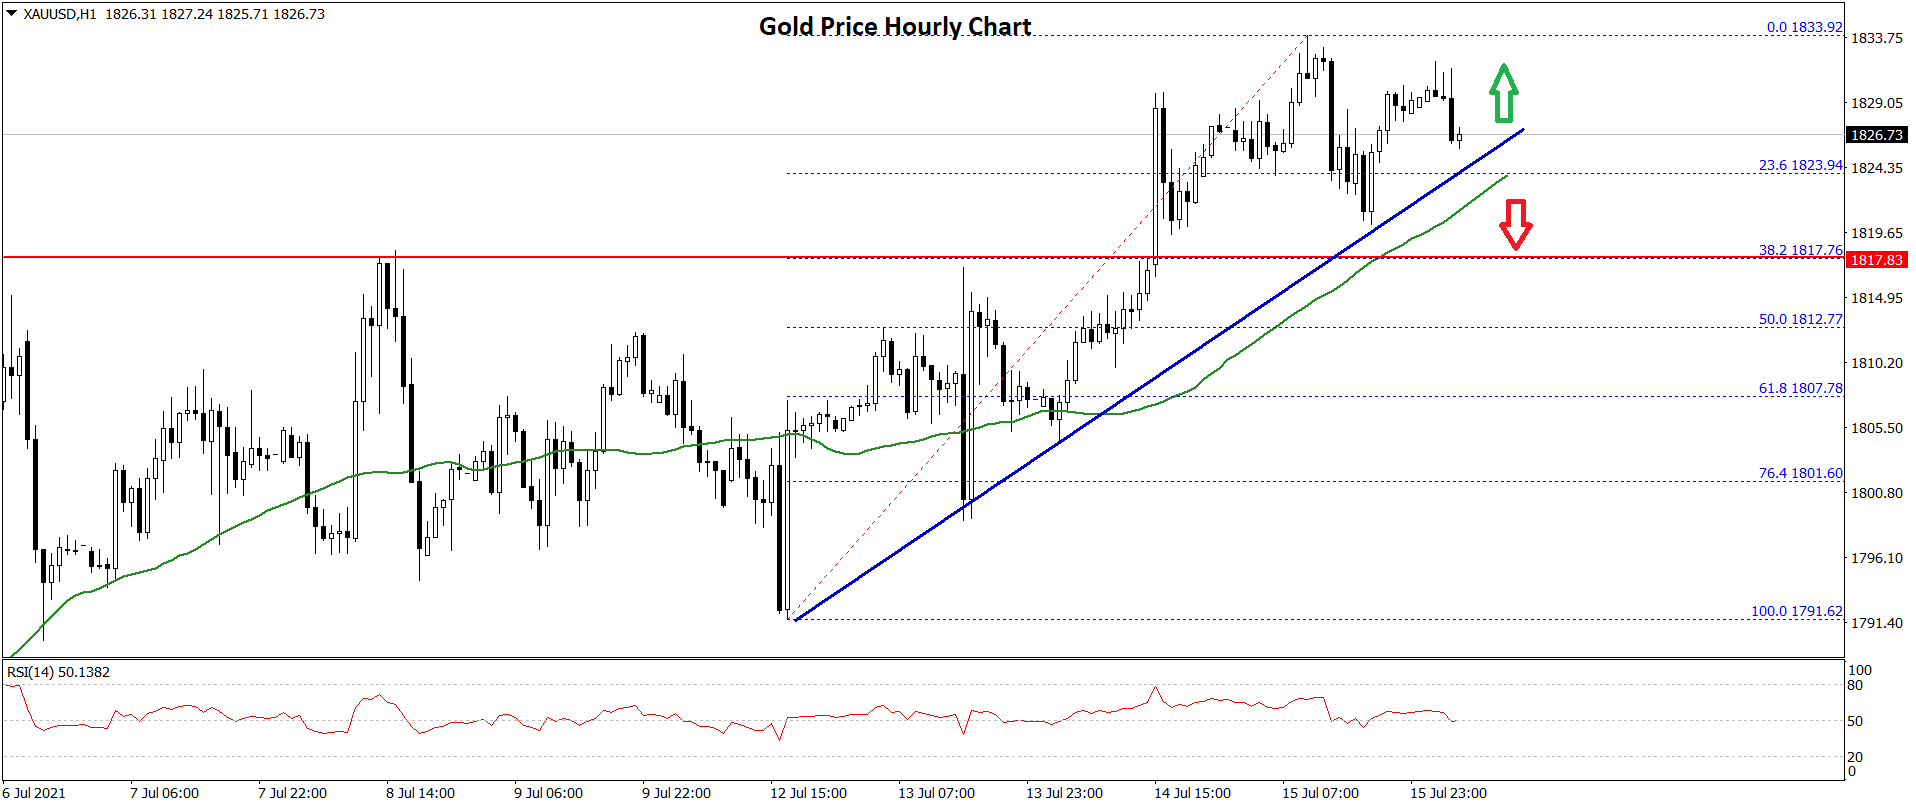
The price even traded below the 23.6% Fib retracement level of the upward move from the $1,791 low to $1,833 high. However, the bulls are protecting the $1,820 support.
There is also a key bullish trend line forming with support near $1,825 on the hourly chart of gold. The 50 hourly SMA is also near the trend line. If there is a downside break, the price could test the $1,810 support.
An intermediate support could be the 50% Fib retracement level of the upward move from the $1,791 low to $1,833 high at $1,812. An immediate resistance on the upside is near the $1,832 level.
The first major resistance is near the $1,835 level. If the price breaks the $1,835 level, it could accelerate higher. In the stated case, the price could rise towards the $1,850 zone.
Oil Price Technical Analysis
Crude oil price extended its upward move above the $73.50 level against the US Dollar. The price even climbed above the $74.50 level, but it failed to continue higher above the $75.00 zone.
The price formed a swing high near the $74.89 before it started a downside correction. There was a break below the $74.00 and $73.50 support levels. The price broke the 50% Fib retracement level of the upward move from the $70.24 low to $74.89 high.
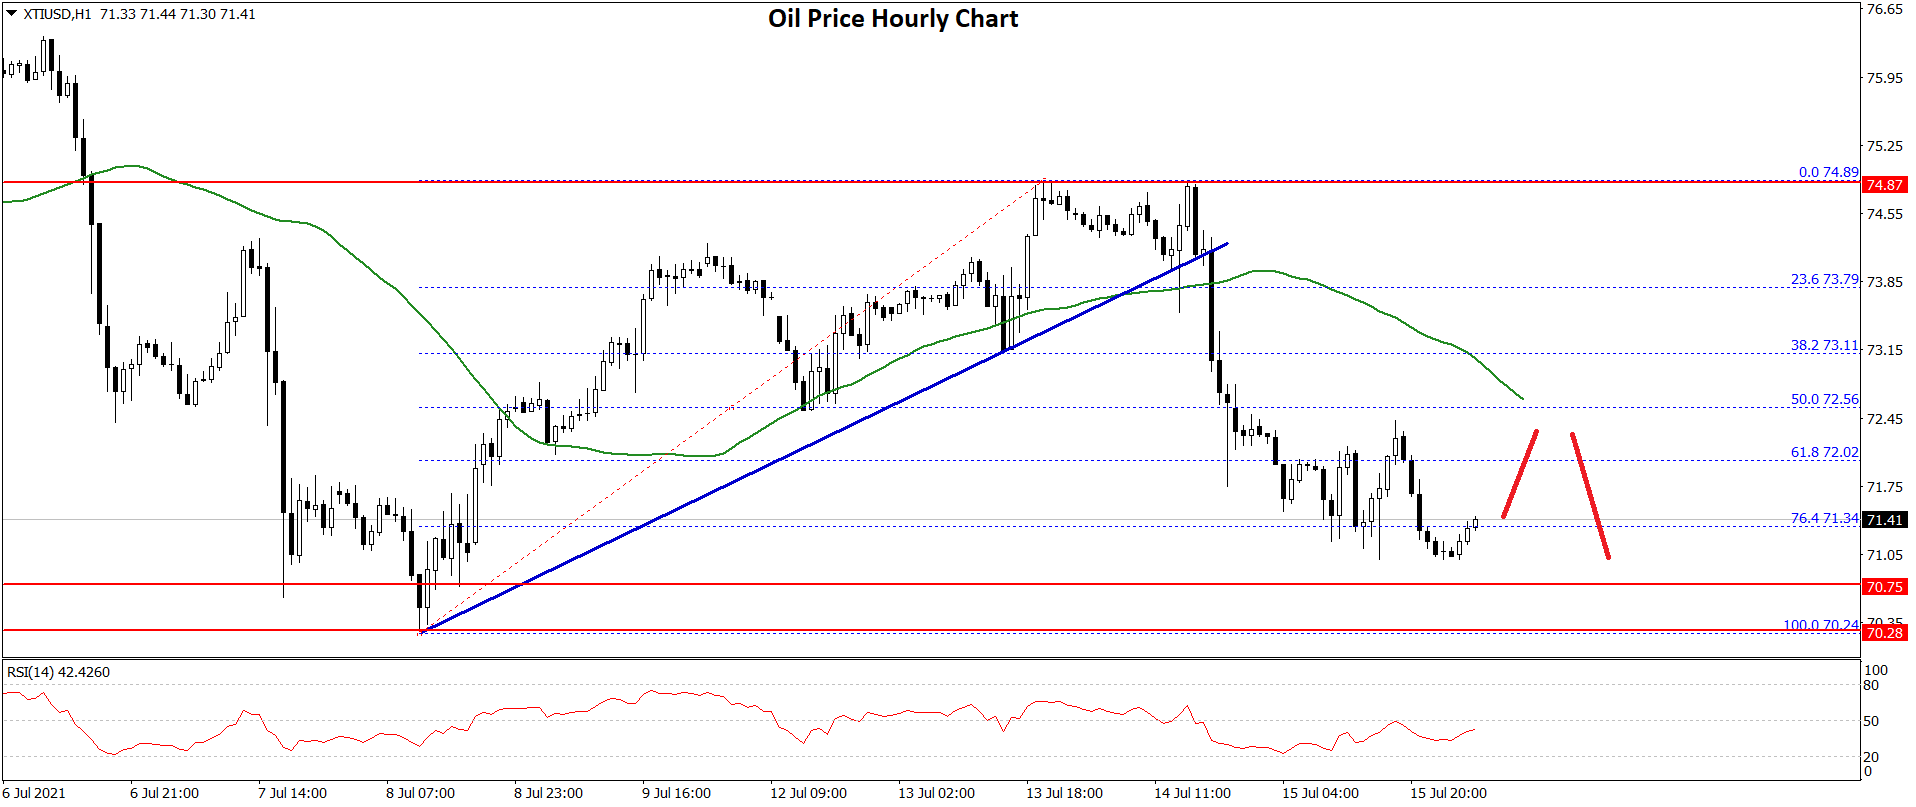
Besides, there was a break below a major bullish trend line with support near $74.55 on the hourly chart of XTI/USD. The price settled below the $72.00 level and the 50 hourly simple moving average.
It is now trading near the 76.4% Fib retracement level of the upward move from the $70.24 low to $74.89 high. On the downside, an initial support is forming near the $70.75 level. The main support is now forming near the $70.00 level.
A downside break below the $70.00 level could open the doors for a move towards the $68.00 support level. On the upside, an initial resistance is near the $72.00 level.
The next key resistance is near the $72.55 level and the 50 hourly SMA. Any more gains could lift the price towards the $74.00 resistance zone in the near term.
This forecast represents FXOpen Markets Limited opinion only, it should not be construed as an offer, invitation or recommendation in respect to FXOpen Markets Limited products and services or as financial advice.
Trade over 50 forex markets 24 hours a day with FXOpen. Take advantage of low commissions, deep liquidity, and spreads from 0.0 pips. Open your FXOpen account now or learn more about trading forex with FXOpen.
This article represents the opinion of the Companies operating under the FXOpen brand only. It is not to be construed as an offer, solicitation, or recommendation with respect to products and services provided by the Companies operating under the FXOpen brand, nor is it to be considered financial advice.
Latest from Forex Analysis
Latest articles

GBP/USD Bulls Struggle While USD/CAD Regains Strength
GBP/USD declined below the 1.2550 support zone. USD/CAD is rising and might aim for more gains above the 1.3760 resistance.
Important Takeaways for GBP/USD and USD/CAD Analysis Today
· The British Pound started a fresh

AUD/USD Analysis: Aussie Weakens After RBA Decision
Following its decision on 7th May, the Reserve Bank of Australia (RBA) opted to maintain the interest rate at 4.35%, despite inflation continuing to decrease at a slower pace than anticipated by the RBA.
"I think we still think

The Hang Seng Index Has Risen by Over 13% in 2 Weeks
Analyzing the Hang Seng (Hong Kong 50 at FXOpen) chart, we wrote on January 30th that the price was near an important support level formed by the lower boundary (shown in orange) of a long-term channel, which has been relevant