


FXOpen

Gold price struggled to clear $1,850 and started a fresh decline below $1,800. Crude oil price traded to a new multi-month high at $62.21 before starting a downside correction.
Important Takeaways for Gold and Oil
- Gold price failed to gain momentum and declined below $1,800 against the US Dollar.
- There is a key bearish trend line forming with resistance near $1,795 on the hourly chart of gold.
- Crude oil price traded to a new multi-month high near $62.21 before correcting lower.
- There was a break below a major bullish trend line with support near $61.20 on the hourly chart of XTI/USD.
Gold Price Technical Analysis
Gold price failed to clear the $1,850 and $1,855 resistance levels against the US Dollar. As a result, there was a fresh decline below the $1,825 and $1,820 support levels.
The price gained bearish momentum below the $1,800 support and it even settled well below the 50 hourly simple moving average. It traded as low as $1,760 on FXOpen and it is currently consolidating losses.
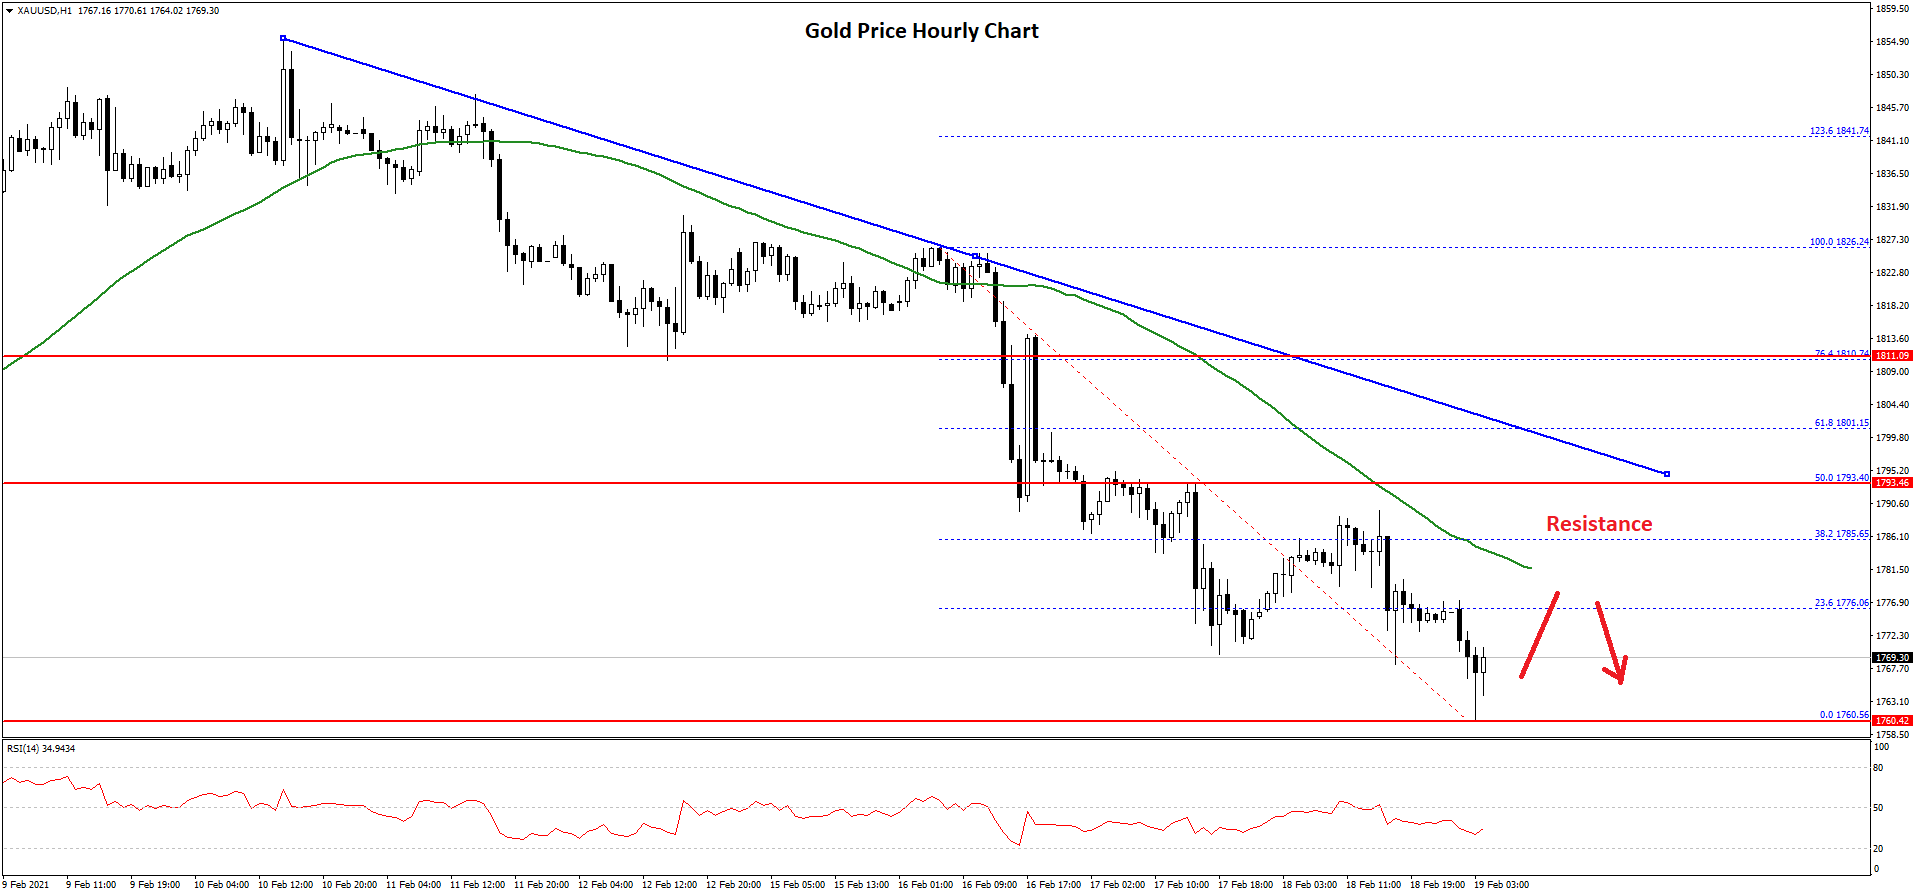
An initial resistance on the upside is near the $1,775 level. It is close to the 23.6% Fib retracement level of the recent decline from the $1,826 swing high to $1,760 low.
The first major resistance is near the $1,780 level or the 50 hourly simple moving average. The next major resistance is near the $1,795 level. There is also a key bearish trend line forming with resistance near $1,795 on the hourly chart of gold.
The trend line resistance is close to the 50% Fib retracement level of the recent decline from the $1,826 swing high to $1,760 low. Therefore, the price might struggle to clear the $1,795 and $1,800 resistance levels in the near term.
On the downside, the first major support is near the $1,760 level. The next major support is near the $1,750 level. Any more losses might call for a move towards the $1,720 support level.
Oil Price Technical Analysis
Crude oil price remained in a strong uptrend and it gained pace above the $58.00 resistance zone against the US Dollar. The price even cleared the $60.00 resistance level and spiked above $62.00.
A new multi-month high was formed near $62.21 before the price started a downside correction. There was a break below the $61.50 support level and the 50 hourly simple moving average.
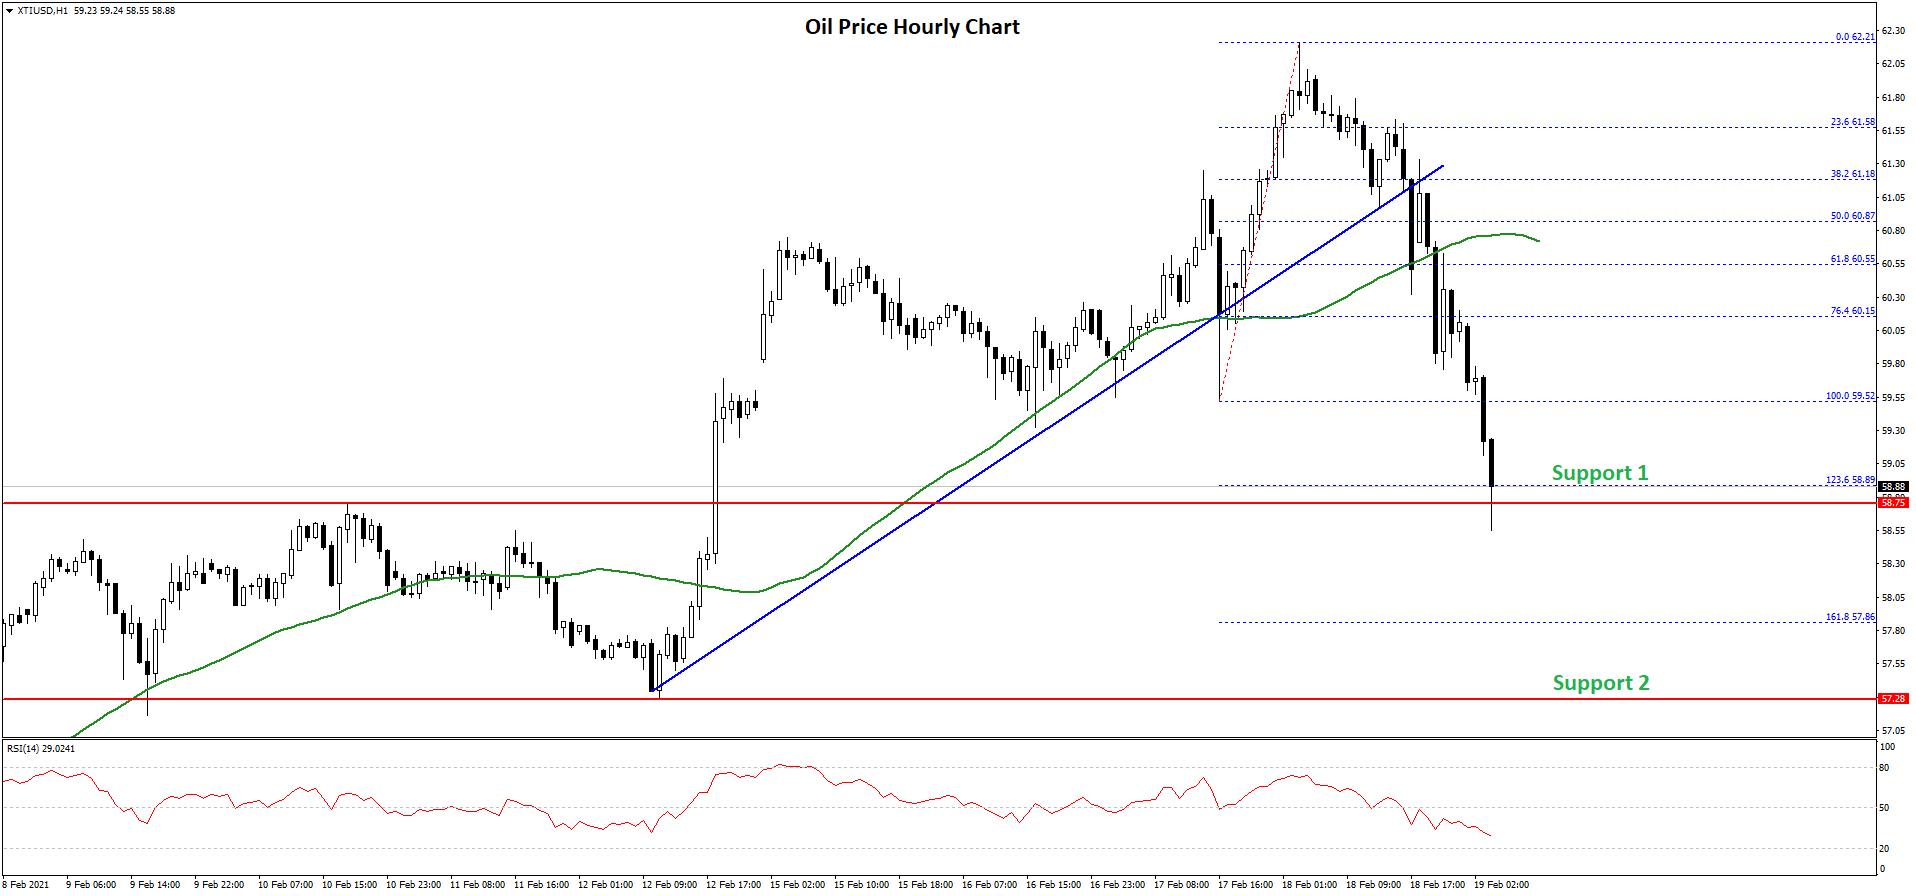
There was also a break below a major bullish trend line with support near $61.20 on the hourly chart of XTI/USD. The price even broke the last swing low at $59.52. It is now testing the 1.236 Fib extension level of the upward move from the $59.52 swing low to $62.21 high.
If the price fails to stay above the $58.50 support level, there are chances of more downsides. The next key support is near the $57.80 level.
The 1.618 Fib extension level of the upward move from the $59.52 swing low to $62.21 high is also near $57.80. Any more losses could lead the price towards the $55.00 support zone.
On the upside, an initial resistance is near the $59.50 level. The main resistance is now forming near the $60.50 level and the 50 hourly simple moving average, above which oil price might start a fresh increase.
Trade over 50 forex markets 24 hours a day with FXOpen. Take advantage of low commissions, deep liquidity, and spreads from 0.0 pips. Open your FXOpen account now or learn more about trading forex with FXOpen.
This article represents the opinion of the Companies operating under the FXOpen brand only. It is not to be construed as an offer, solicitation, or recommendation with respect to products and services provided by the Companies operating under the FXOpen brand, nor is it to be considered financial advice.
Latest from Forex Analysis
Latest articles

EUR/USD Dives While USD/CHF Extends Rally
EUR/USD started a fresh decline below the 1.0695 support. USD/CHF is rising and might aim a move toward the 0.9250 resistance.
Important Takeaways for EUR/USD and USD/CHF Analysis Today
· The Euro struggled to clear

The Dollar Is Losing Some of Its Gains While Awaiting a Verdict from the Fed
The American currency continues to trade in different directions relative to leading currencies. Thus, the yen paired with theUS dollar fell in price to a 34-year low, and in pairs with European and commodity currencies we are seeing a corrective

5 Stocks To Consider For May 2024
Time flies, especially when things are running smoothly, and this year so far has been a period free of dramatic events across the capital markets.
Suddenly, we are almost halfway through 2024, and the forthcoming month takes us up to