


FXOpen
Crude oil price faced a lot of selling pressure recently, resulting in a downside push below $70.00 and $68.00 support levels. On the other hand, gold price remains in an uptrend and is currently holding a key support near $1,295.00.
Important Takeaways for Gold and Oil
- Gold price corrected lower from the $1,307 swing high against the US Dollar.
- There are two bullish trend lines with a crucial support near $1,295 on the hourly chart of gold.
- Crude oil price failed to move above the $73.00 barrier and declined sharply.
- There was a sharp downside reaction below $70.00 and the price moved into a bearish trend.
Gold Price Technical Analysis
This past week, there were positive moves in gold price above the $1,280 support level against the US Dollar. The price traded higher and moved above the $1,290 and $1,300 resistance levels.
However, the price failed to test the $1,310 level and a high was formed at $1,307. Later, a downside correction was initiated and the price moved below the $1,302 and $1,300 support levels.
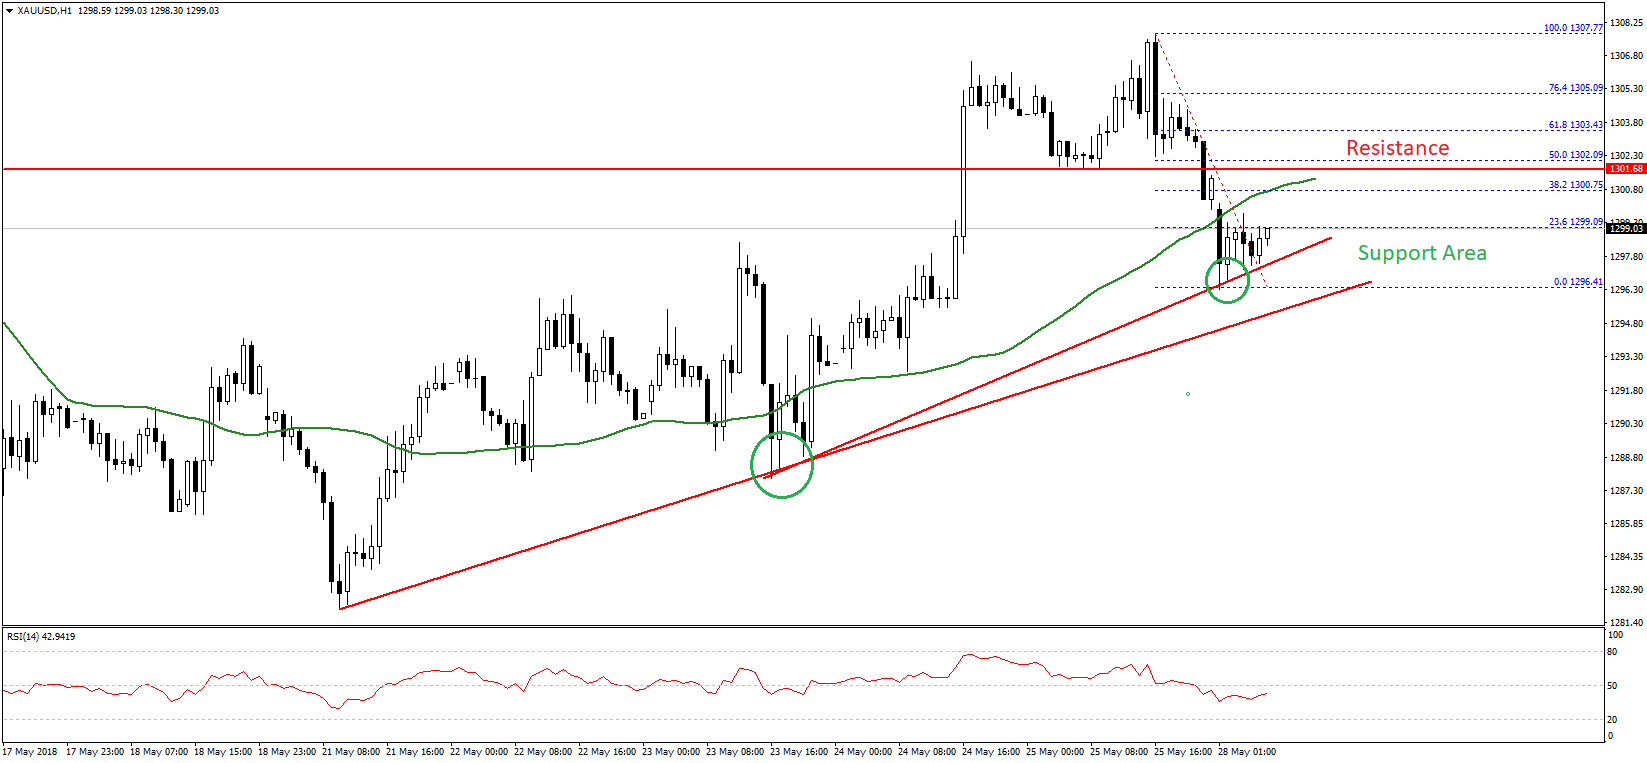
The decline was protected by the $1,295-1,296 support area. Moreover, there are two bullish trend lines with a crucial support near $1,295 on the hourly chart of gold. These trend lines are acting as a key support and preventing sellers from taking control below $1,295.
The recent low was $1,296 before buyers appeared. At the moment, the price is correcting higher and is testing the 23.6% Fib retracement level of the last decline from the $1,307 high to $1,296 low.
On the upside, an initial resistance is near the $1,300 level and the 50 hourly simple moving average. However, a major resistance is close to the $1,302 level, which was a support earlier. Moreover, the 50% Fib retracement level of the last decline from the $1,307 high to $1,296 low is also near $1,302.
Therefore, on the upside, a break above $1,302 is needed for a bullish acceleration. On the flip side, a close below the trend lines and the $1,295 support may perhaps open the doors for a larger downward correction.
Oil Price Technical Analysis
After a major bullish ride above the $70.00 level, crude oil price failed near the $73.00 level. There were ranging moves above the $70.00 level for a few sessions before the price started a downside move.
The price tumbled and broke many support levels on the way down such as $70.00, $68.00 and $67.00. It even settled below the $68.00 pivot level and the 50 hourly simple moving average.
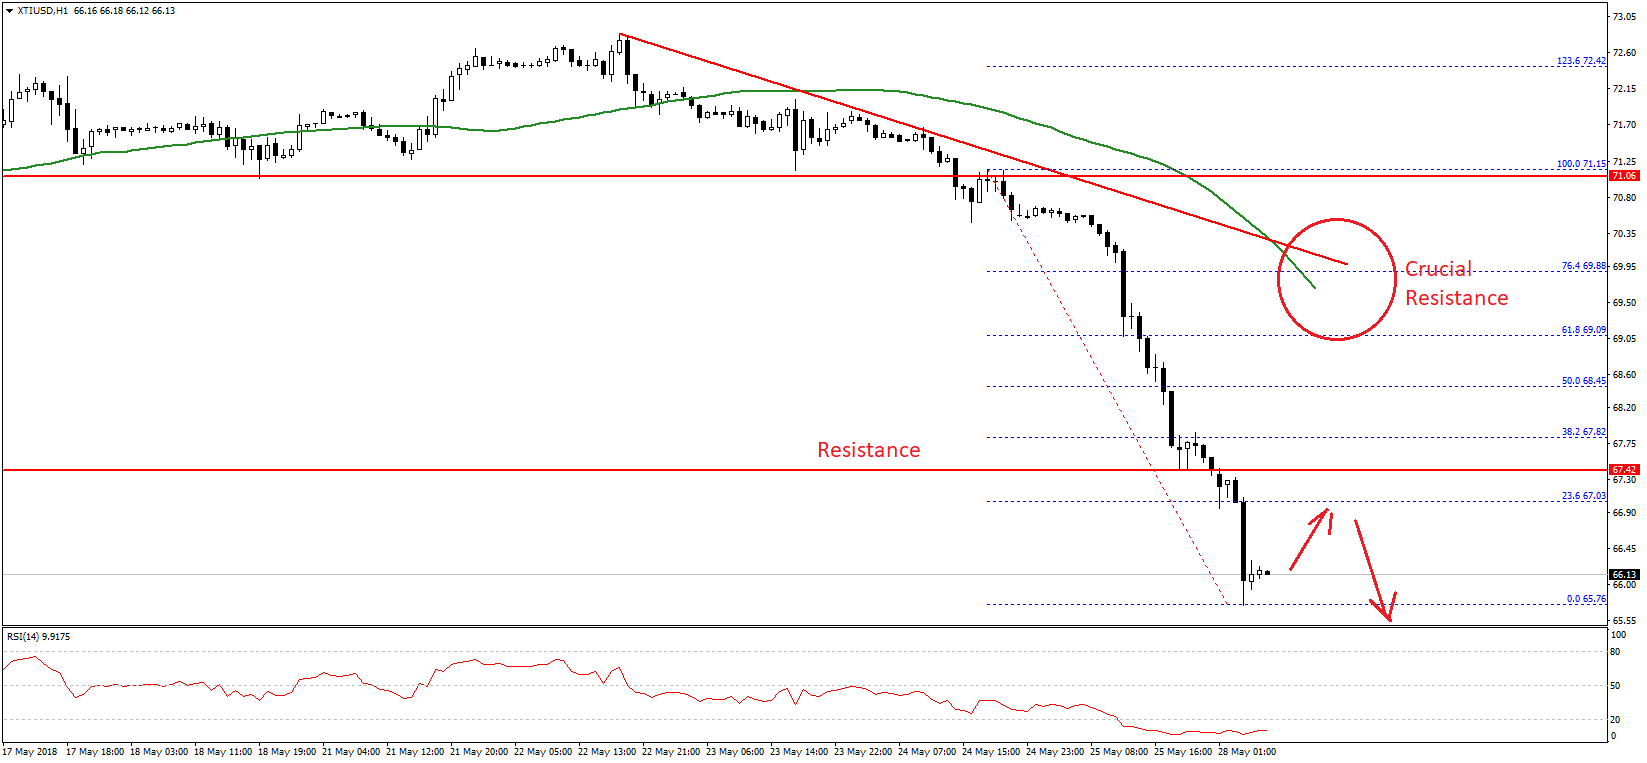
It traded as low as $65.76 recently and is currently consolidating losses. It may correct a few points in the near term towards the 23.6% Fib retracement level of the last decline from the $71.15 high to $65.76 low.
However, there are less chances of any major upside correction above the $67.50 and $68.00 resistance levels. Should there be an upside break above $68.00, the next hurdle for buyers is near the 50% Fib retracement level of the last decline from the $71.15 high to $65.76 low at $68.50.
There is also a bearish trend line on the hourly chart with resistance at $69.80, which is positioned near the 50 hourly simple moving average. Therefore, there are many hurdles on the upside for buyers, starting with $67.50 and up to $69.80.
On the downside, a break below the $65.00 support could open the doors for a test of $60.00.
Trade over 50 forex markets 24 hours a day with FXOpen. Take advantage of low commissions, deep liquidity, and spreads from 0.0 pips. Open your FXOpen account now or learn more about trading forex with FXOpen.
This article represents the opinion of the Companies operating under the FXOpen brand only. It is not to be construed as an offer, solicitation, or recommendation with respect to products and services provided by the Companies operating under the FXOpen brand, nor is it to be considered financial advice.
Latest from Forex Analysis
Latest articles

Hong Kong-listed Chinese Insurer Goes on Rally as Western Giants Retract
The Asia Pacific region has once again become an area of great interest to investors and traders as some remarkable patterns of volatility have begun to make their presence felt.
This morning, a few examples of Hong Kong-listed Chinese companies

Bitcoin Price Bullish after Halving-2024
On April 19, 2024, a halving occurred in the Bitcoin network, resulting in the reward for the mined block amounting to 3.125 BTC.
Historically, after the halving (which is associated with a reduction in supply), the price of Bitcoin

What Is a Change of Character (CHoCH) and How Can You Trade It?
Navigating the nuances of Smart Money Concept (SMC) trading requires a keen understanding of market signals like the Change of Character (CHoCH). This concept can help traders detect and react to potential trend reversals. Today, we’ll delve into the