


FXOpen

Gold price managed to recover and settled above the $1,550 support area. However, crude oil price declined heavily and it recently broke the $56.00 support area.
Important Takeaways for Gold and Oil
- Gold price remained well bid above $1,550 and it recently climbed towards $1,565 against the US Dollar.
- There is a major bullish trend line forming with support near $1,555 on the hourly chart of gold.
- Crude oil price is facing an increase in selling pressure and declined below $58.00 and $56.00.
- There is a key bearish trend line forming with resistance near $56.60 on the hourly chart of XTI/USD.
Gold Price Technical Analysis
After a steady decline, gold price found support near the $1,532 and $1,535 levels against the US Dollar. As a result, the price started a decent upward move and settled above the $1,550 resistance area.
It even surpassed the $1,560 resistance and the 50 hourly simple moving average. However, the bulls struggled to clear the $1,565 and $1,568 resistance levels.
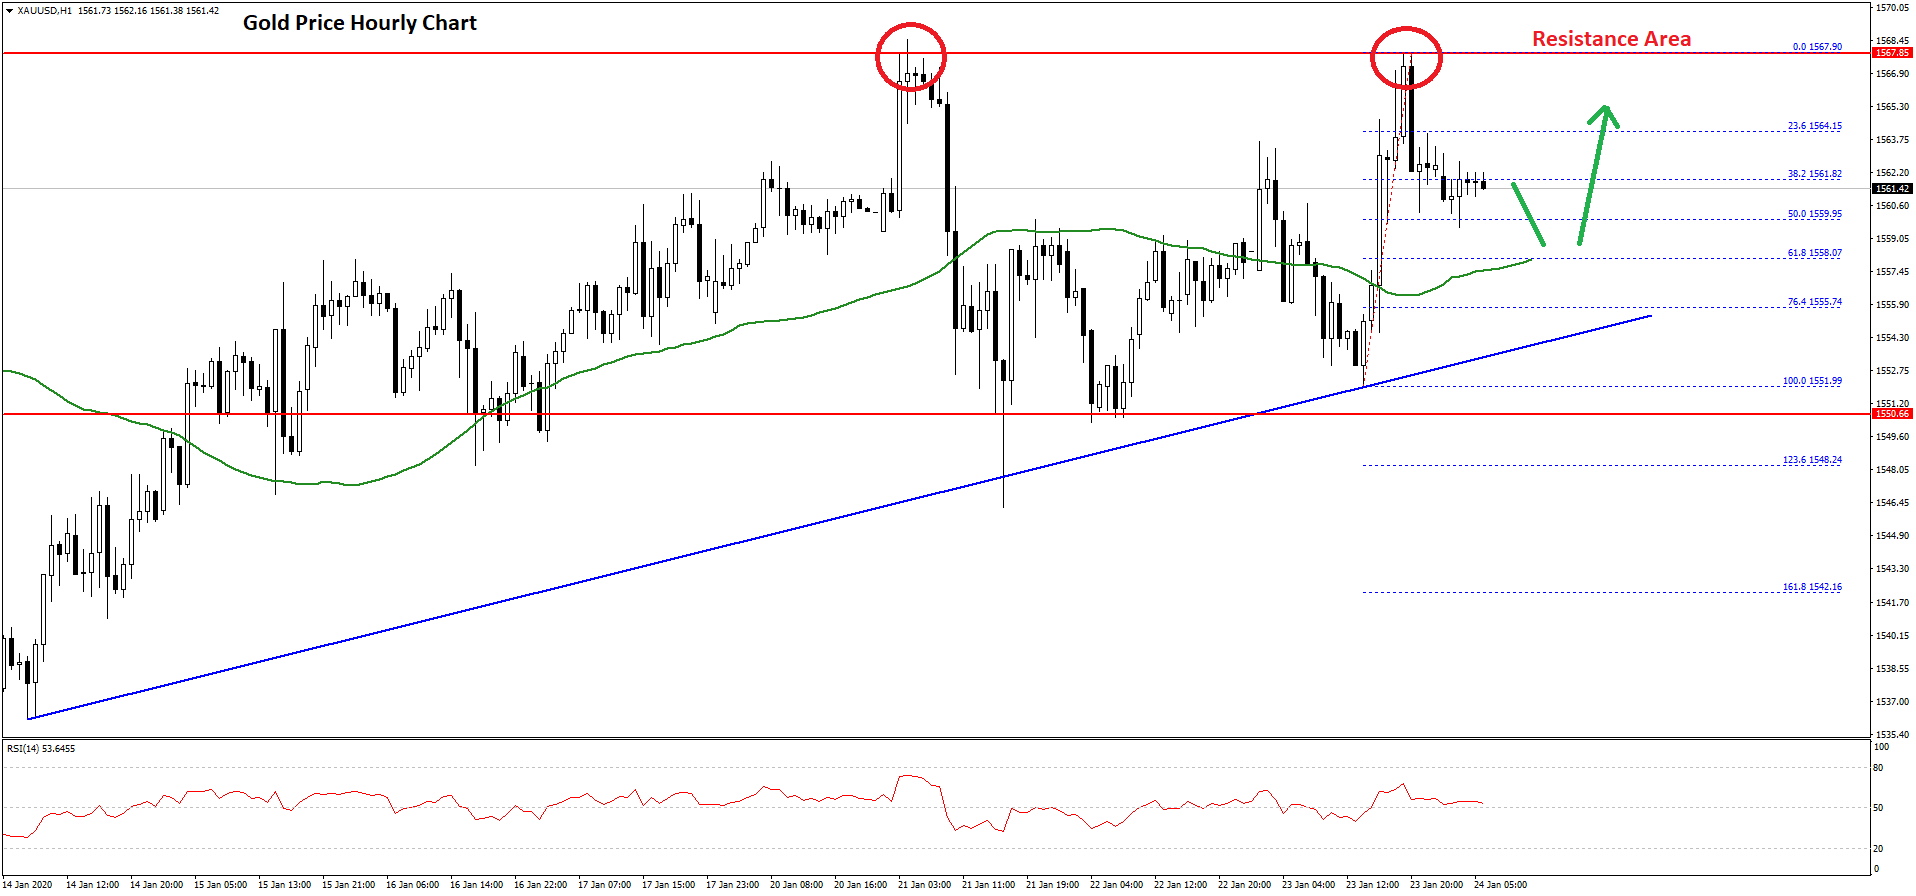
The price was rejected on two occasions near $1,568 and the recent high was formed near $1,567 on FXOpen. It is currently correcting lower and trading below the $1,562 support.
Besides, there was a break below the 23.6% Fib retracement level of the recent wave from the $1,551 low to $1,567 high. On the downside, the first key support is near the $1,558 level.
Furthermore, the 50% Fib retracement level of the recent wave from the $1,551 low to $1,567 high is also near the $1,559 level and the 50 hourly simple moving average.
More importantly, there is a major bullish trend line forming with support near $1,555 on the hourly chart of gold. Therefore, dips remain well supported on the downside near the $1,558 and $1,555 levels.
The main support is near the $1,550 level, below which gold price might turn bearish and decline towards $1,535. On the upside, there is a strong resistance near $1,567 and $1,568, above which the bulls are likely to aim $1,575 in the near term.
Oil Price Technical Analysis
In the past few days, there was a sharp decline in crude oil price from well above the $58.00 level against the US Dollar. The price broke many supports near the $57.20 and $56.50 levels to enter a bearish zone.
Moreover, there was a close below the $56.00 level and the 50 hourly simple moving average. Finally, it declined below the $55.50 level and traded to a new weekly low at $54.77.

It is currently correcting higher above the $55.00 level. There was a break above the 23.6% Fib retracement level of the recent slide from the $58.74 high to $54.77 low.
On the upside, there is a strong resistance forming near the $56.50 level and the 50 hourly simple moving average. Moreover, there is a key bearish trend line forming with resistance near $56.60 on the hourly chart of XTI/USD.
The 50% Fib retracement level of the recent slide from the $58.74 high to $54.77 low is also near $56.75. Therefore, crude oil price must surpass the $56.50-$57.75 resistance area to start a decent recovery in the near term.
If not, there is a risk of more losses below the $55.20 and $54.80 levels in the coming sessions.
Trade over 50 forex markets 24 hours a day with FXOpen. Take advantage of low commissions, deep liquidity, and spreads from 0.0 pips. Open your FXOpen account now or learn more about trading forex with FXOpen.
This article represents the opinion of the Companies operating under the FXOpen brand only. It is not to be construed as an offer, solicitation, or recommendation with respect to products and services provided by the Companies operating under the FXOpen brand, nor is it to be considered financial advice.
Latest from Forex Analysis
Latest articles

Germany's DAX 40 Index Flying High Despite Pessimistic National Outlook
For a number of years now, there has been a lot of discourse over the current situation and the future of the German domestic economy.
From both inside Germany and globally, analysts, government officials, and corporate leaders have demonstrated a

Volatility in the Pound Is Rising, the Euro is Consolidating
GBP/USD
At the end of last week, the British currency fell sharply, testing a significant support level at 1.2300. The resumption of the downward trend for the pair became possible after some statements by British officials:
- On Wednesday,

The Price of Gold XAU/USD Shows Strongest Fall in Almost 2 Years
On Monday, the price of gold fell from USD 2,386 to USD 2,333 per ounce — this is the strongest drop in one day in almost 2 years, according to Bloomberg. On Tuesday morning in the Asian session, the