


FXOpen

Gold price failed to clear the $1,800 resistance zone and started a fresh decline. Crude oil price is rising and it is showing a lot of positive signs above $64.50.
Important Takeaways for Gold and Oil
- Gold price failed to clear the $1,790 and $1,800 resistance levels against the US Dollar.
- There is a key bearish trend line forming with resistance near $1,788 on the hourly chart of gold.
- Crude oil price climbed higher nicely and it even broke the $65.00 resistance zone.
- There is a crucial bullish trend line forming with support near $64.30 on the hourly chart of XTI/USD.
Gold Price Technical Analysis
Earlier this week, gold price climbed higher above the $1,780 resistance against the US Dollar. However, it failed to clear the $1,790 and $1,800 resistance levels.
A high was formed near $1,789 on FXOpen before the price started a fresh decline. There was a break below the $1,780 and $1,765 support levels. The price even settled below the $1,780 level and the 50 hourly simple moving average.
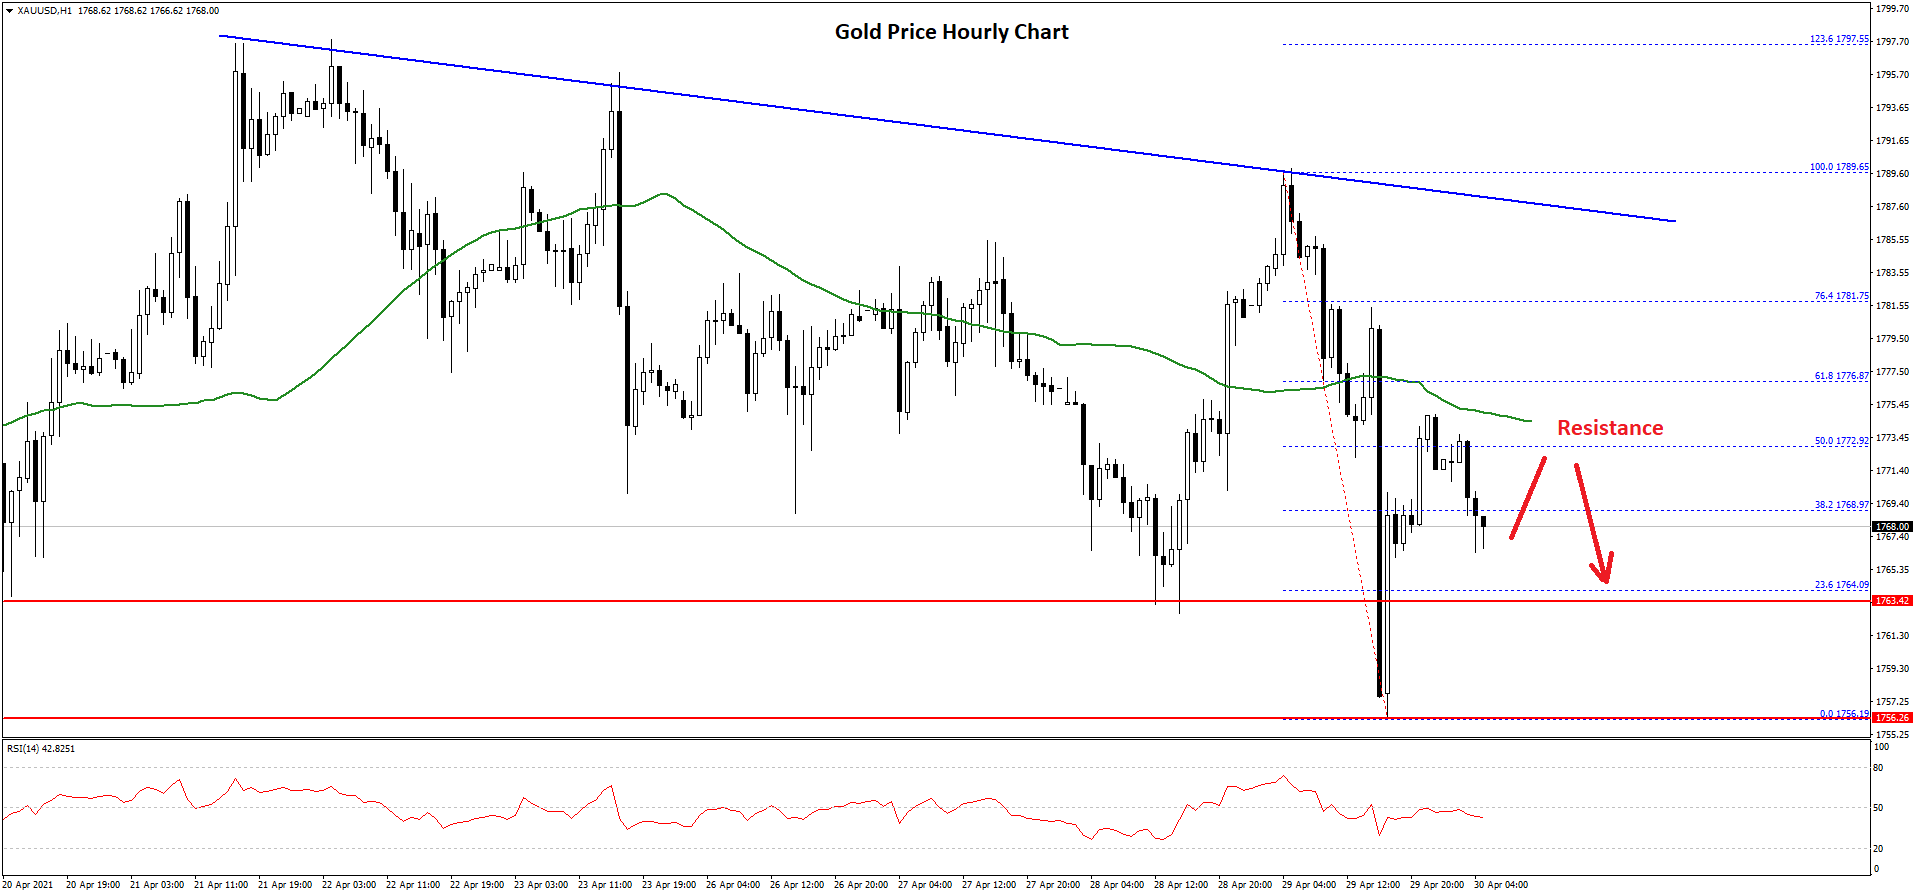
A low was formed near $1,756 before the price recovered. It climbed above the $1,765 level. There was a break above the 23.6% Fib retracement level of the recent decline from the $1,789 high to $1,756 low.
However, the price failed to clear the $1,780 resistance and the 50 hourly simple moving average. It also struggled near the 50% Fib retracement level of the recent decline from the $1,789 high to $1,756 low.
Moreover, there is a key bearish trend line forming with resistance near $1,788 on the hourly chart of gold. The price must clear the $1,780 resistance and the trend line to start a strong increase in the coming sessions.
If not, there is a risk of another decline below the $1,760 level. The first key support is near the $1,755 and $1,750 levels. Any more losses might call for a test of the $1,720 support.
Oil Price Technical Analysis
Crude oil price remained well supported above the $60.00 zone against the US Dollar. As a result, the price started a fresh increase above the $62.00 resistance zone.
The price was able to surge above the $63.50 and $64.00 levels. There was also a break above the $64.50 resistance and the 50 hourly simple moving average. A high is formed near $65.36 and the price is now consolidating gains.
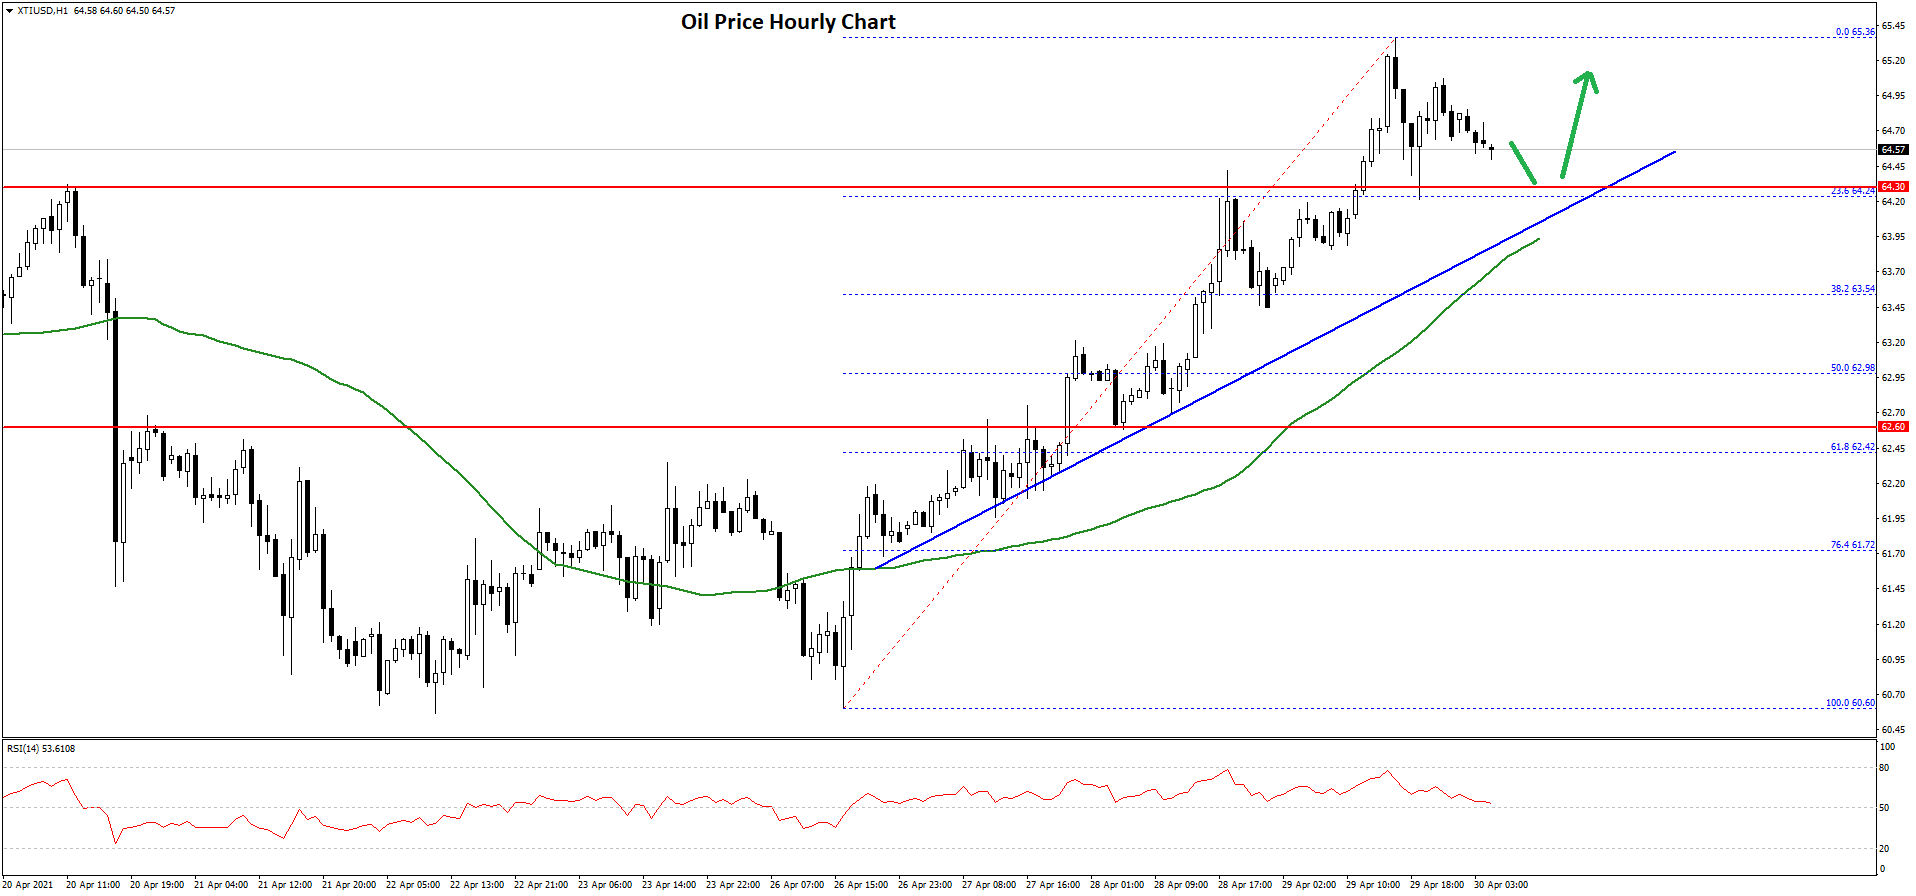
It is trading near the $64.60 level. An initial support is near the $64.30 level. It is near the 23.6% Fib retracement level of the recent wave from the $60.60 low to $65.36 high.
There is also a crucial bullish trend line forming with support near $64.30 on the hourly chart of XTI/USD. If there is a downside break below the trend line support, the price could decline towards the $63.00 support.
The 50% Fib retracement level of the recent wave from the $60.60 low to $65.36 high is also near the $62.98 level to provide support. Any more losses could set the pace for a drop towards the $62.50 level.
On the upside, the price is facing resistance near the $65.50 level. If there is an upside break above $65.50, the price could rally towards the $66.50 and $68.00 levels. The next major resistance is near the $70.00 level.
This forecast represents FXOpen Markets Limited opinion only, it should not be construed as an offer, invitation or recommendation in respect to FXOpen Markets Limited products and services or as financial advice.
Trade over 50 forex markets 24 hours a day with FXOpen. Take advantage of low commissions, deep liquidity, and spreads from 0.0 pips. Open your FXOpen account now or learn more about trading forex with FXOpen.
This article represents the opinion of the Companies operating under the FXOpen brand only. It is not to be construed as an offer, solicitation, or recommendation with respect to products and services provided by the Companies operating under the FXOpen brand, nor is it to be considered financial advice.
Latest from Forex Analysis
Latest articles

Since the Start of the Week, Brent Oil Price Has Dropped over 4%
At the beginning of the week, March 15, we wrote that the price of Brent oil could form a correction from the resistance level of USD 91 per barrel. Since then, the price has decreased by more than 4% due

Fair Value Gaps vs Liquidity Voids in Trading
Understanding fair value gaps and liquidity voids is essential for traders seeking to navigate the complexities of the financial markets. These concepts, deeply rooted in the Smart Money Concept (SMC), provide valuable insights into the dynamics of supply and demand,

UK100 Share Index Rises as UK Inflation Slows
Yesterday, the UK Office for National Statistics (ONS) reported that the CPI stood at 3.2% in March. According to ForexFactory, analysts expected 3.1%, and a month ago the index was 3.4%.
Grant Fitzner, chief economist at the