


FXOpen

Gold price rallied to a new multi-year high above $1,815 before correcting lower. Crude oil price is currently declining and trading in a bearish zone below $40.00.
Important Takeaways for Gold and Oil
- Gold price extended its upward move and traded a new multi-year high at $1,817 against the US Dollar.
- There is a crucial bullish trend line forming with support near $1,795 on the hourly chart of gold.
- Crude oil price started a fresh decline after it failed to gain strength above $41.00.
- There was a break below a major bullish trend line with support near $40.65 on the hourly chart of XTI/USD.
Gold Price Technical Analysis
Gold price remained in a strong uptrend and it managed to climb above the $1,780 and $1,800 resistance levels against the US Dollar. The price traded to a new multi-year high at $1,817 on FXOpen.
Recently, it started a downside correction from the $1,817 high. There was a break below the $1,812 and $1,810 support levels. The price traded below the 23.6% Fib retracement level of the upward move from the $1,773 low to $1,817 high.
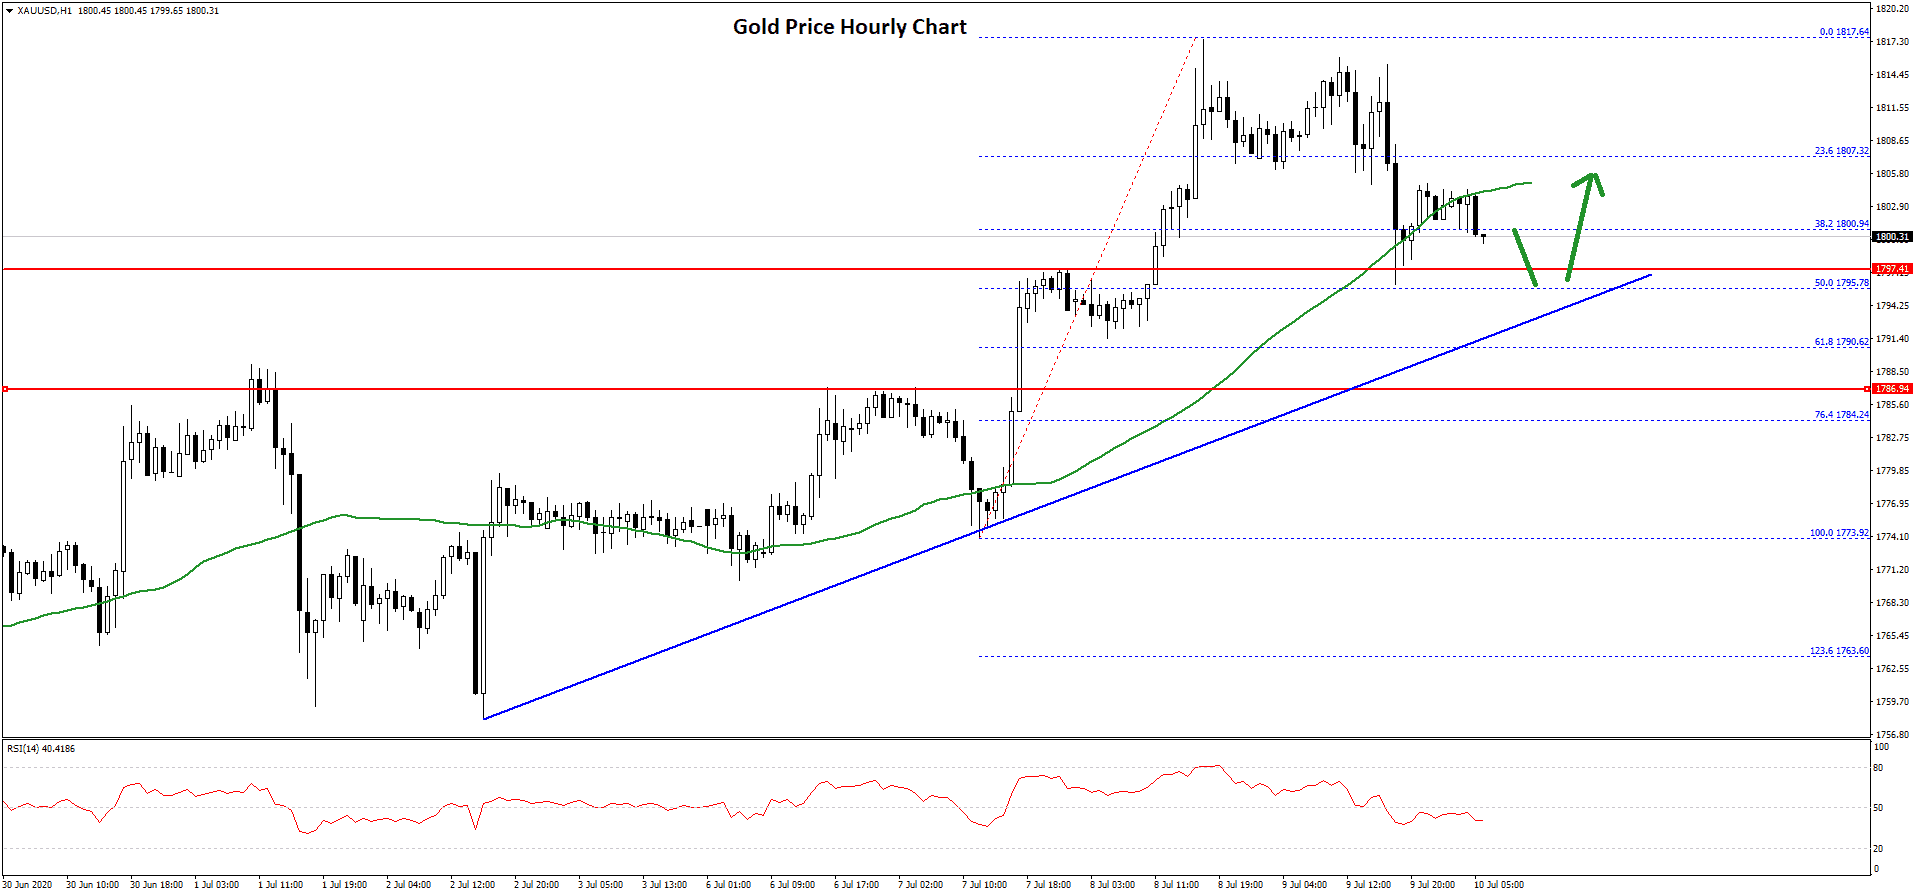
There was a close below the $1,805 level and the 50 hourly simple moving average. However, the $1,800 region is currently acting as a support. There is also a crucial bullish trend line forming with support near $1,795 on the hourly chart of gold.
The trend line coincides with the 50% Fib retracement level of the upward move from the $1,773 low to $1,817 high. If the bulls fail to protect the trend line support, there is a risk of a larger decline.
The next major support is near the $1,785 level. Any further losses may perhaps lead the price towards the $1,760 level. On the upside, the price is facing hurdles near the $1,805 and $1,808 levels.
The main resistance is now near the $1,815 level, above which the bulls might aim a break above the $1,825 level in the near term.
Oil Price Technical Analysis
Crude oil price made a couple of attempts to clear the $41.00 and $41.10 resistance levels against the US Dollar. However, there was no upside break and the price started a fresh decline from the $41.11 swing high.
It broke the $40.80 and $40.60 support levels to move into a short term bearish zone. Moreover, there was a break below a major bullish trend line with support near $40.65 on the hourly chart of XTI/USD.
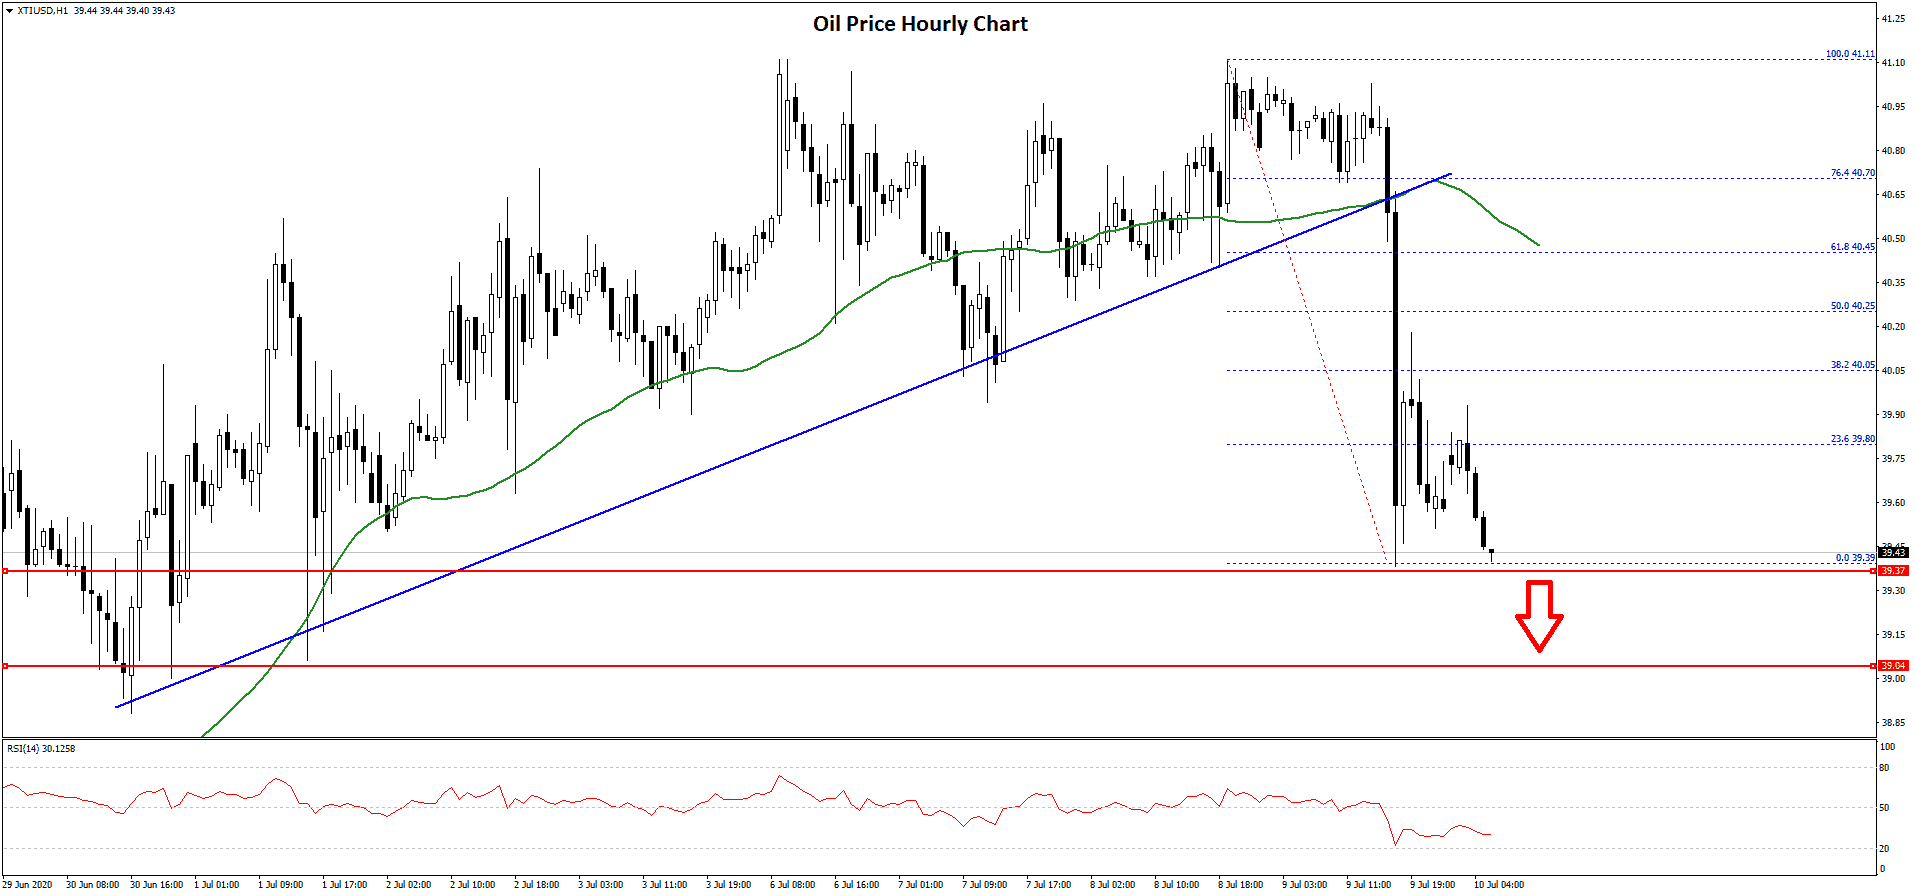
The price traded below the $39.80 level and settled well below the 50 hourly simple moving average. A low is formed near $39.39 and the price is currently consolidating losses.
An initial resistance is near the $39.80 level or the 23.6% Fib retracement level of the recent decline from the $41.11 high to $39.39 low. The first major resistance on the upside is near the $40.00 level.
The next major resistance could be near $40.50, the 50 hourly simple moving average, and the 50% Fib retracement level of the recent decline from the $41.11 high to $39.39 low. A successful close above $40.00 and then a follow through move above $40.50 is needed for a fresh increase.
Conversely, the price might resume its decline below the $39.40 and $39.20 levels. The main support is near the $39.00 level, below which the price could test the $38.20 level.
Trade over 50 forex markets 24 hours a day with FXOpen. Take advantage of low commissions, deep liquidity, and spreads from 0.0 pips. Open your FXOpen account now or learn more about trading forex with FXOpen.
This article represents the opinion of the Companies operating under the FXOpen brand only. It is not to be construed as an offer, solicitation, or recommendation with respect to products and services provided by the Companies operating under the FXOpen brand, nor is it to be considered financial advice.
Latest from Forex Analysis
Latest articles

Germany's DAX 40 Index Flying High Despite Pessimistic National Outlook
For a number of years now, there has been a lot of discourse over the current situation and the future of the German domestic economy.
From both inside Germany and globally, analysts, government officials, and corporate leaders have demonstrated a

Volatility in the Pound Is Rising, the Euro is Consolidating
GBP/USD
At the end of last week, the British currency fell sharply, testing a significant support level at 1.2300. The resumption of the downward trend for the pair became possible after some statements by British officials:
- On Wednesday,

The Price of Gold XAU/USD Shows Strongest Fall in Almost 2 Years
On Monday, the price of gold fell from USD 2,386 to USD 2,333 per ounce — this is the strongest drop in one day in almost 2 years, according to Bloomberg. On Tuesday morning in the Asian session, the