


FXOpen

Gold price started a major decline below the $1,850 and $1,820 support levels. Crude oil price is also trimming gains and it traded below $70.50.
Important Takeaways for Gold and Oil
- Gold price started a fresh decline from well above the $1,850 level against the US Dollar.
- There is a connecting bearish trend line forming with resistance near $1,825 on the hourly chart of gold.
- Crude oil price climbed higher towards $72.75 before correcting lower.
- There was a break below a major bullish trend line with support near $71.20 on the hourly chart of XTI/USD.
Gold Price Technical Analysis
This week, gold price faced an increase in selling pressure near $1,900 against the US Dollar. The price started a major decline and it traded below many important supports near $1,880 and $1,850.
The price even settled below the $1,850 level and the 50 hourly simple moving average. There was a break below the $1,820 support and $1,800. A low is formed near $1,762 on FXOpen and the price is now correcting losses.
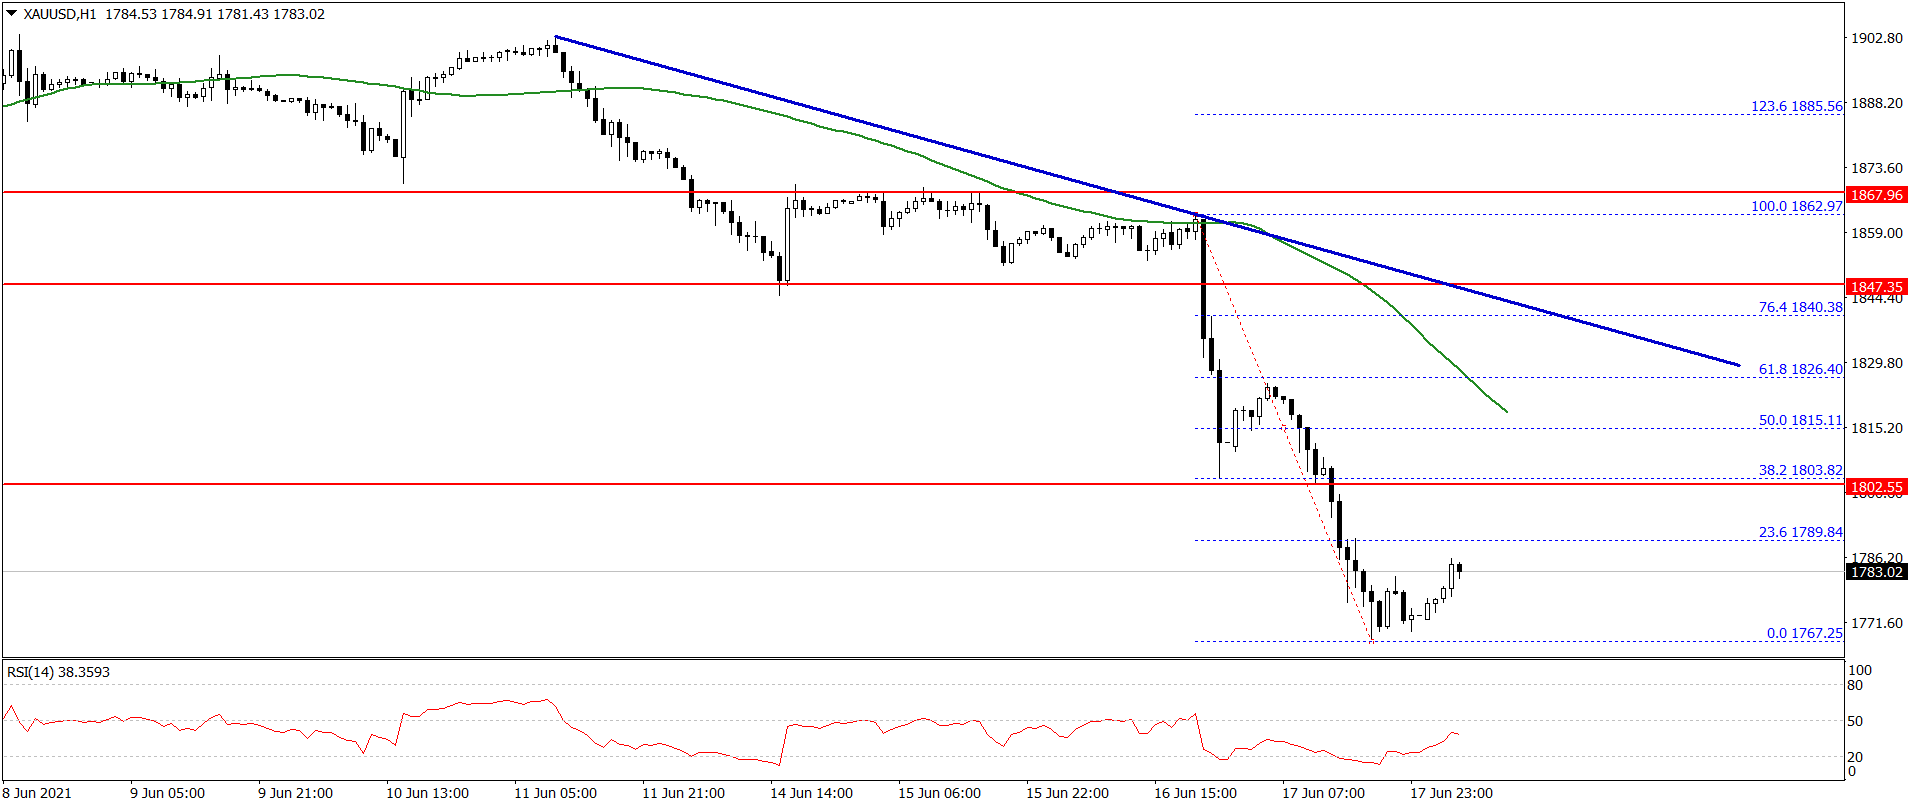
An immediate resistance on the upside is near the $1,790 level. It is near the 23.6% Fib retracement level of the recent decline from the $1,862 swing high to $1,762 low.
The first major resistance is near the $1,800 level. There is also a connecting bearish trend line forming with resistance near $1,825 on the hourly chart of gold. An intermediate resistance is near the $1,815 level and the 50 hourly SMA.
The 50% Fib retracement level of the recent decline from the $1,862 swing high to $1,762 low is also near the $1,815 level. Conversely, the price might resume its decline below $1,780. An initial support is near the $1,775 level.
The first major support is near the $1,765 level. The next key support is near the $1,750 level, below which the price might continue to move down towards the $1,720 level in the near term.
Oil Price Technical Analysis
Crude oil price extended its upward move above the $70.00 level against the US Dollar. The price even climbed above the $72.00 level and it traded to a new multi-month high.
A high was formed near $72.71 before the price started a downside correction. There was a break below the $71.20 level and the 50 hourly simple moving average. The price even broke the $70.00 support zone.
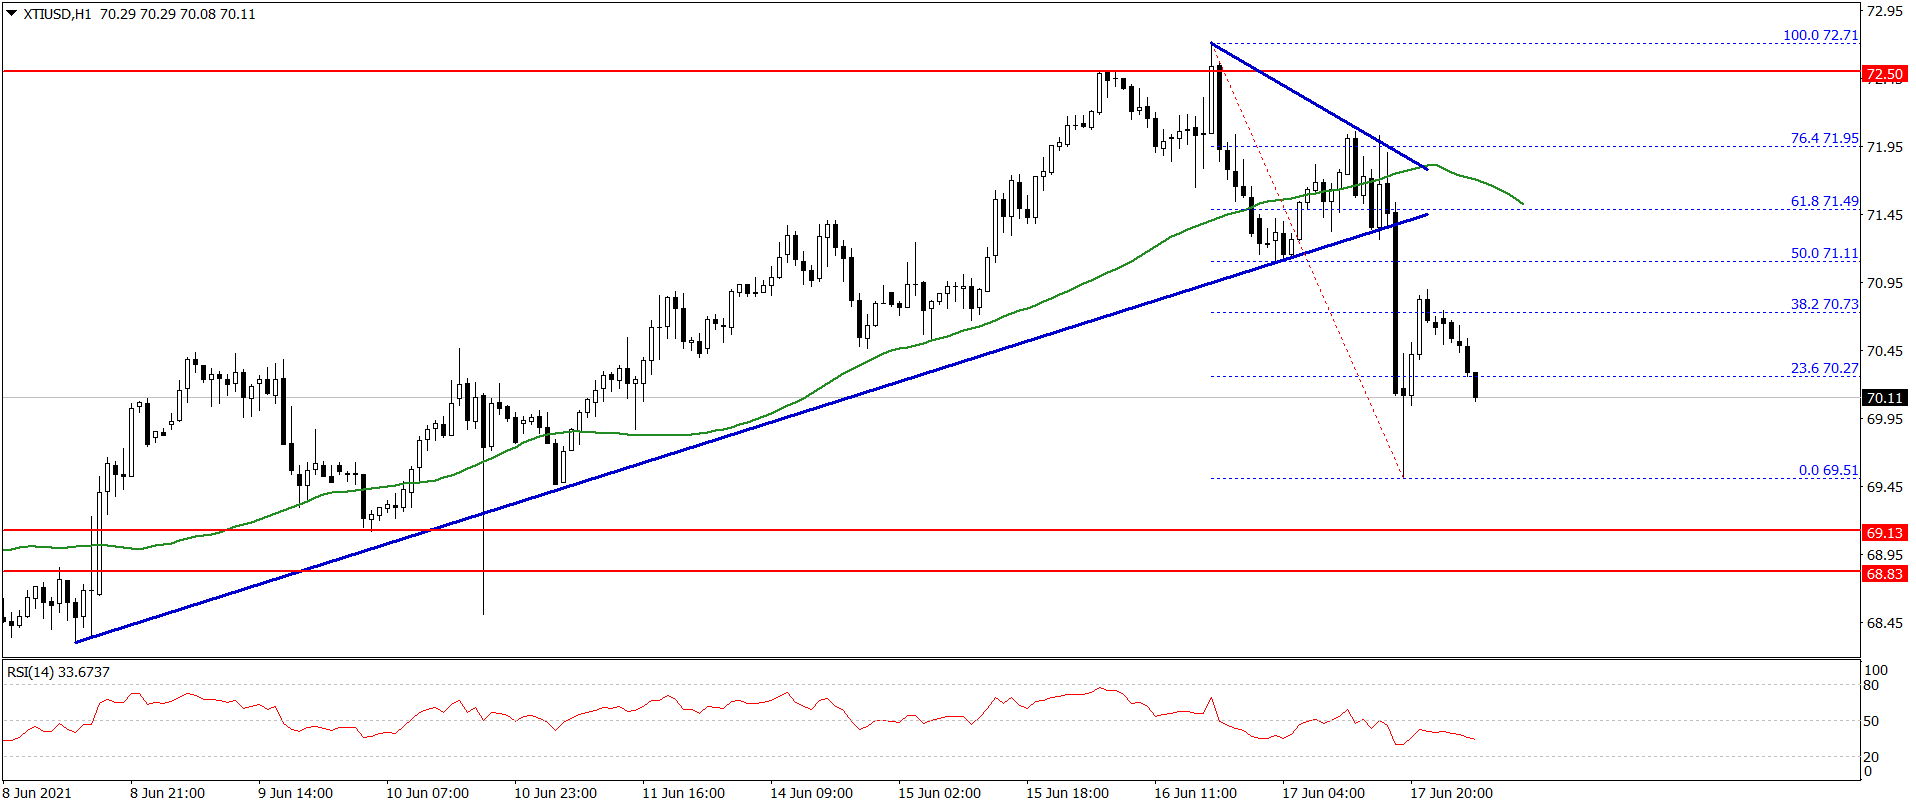
A low was formed near $69.51 and the price is now recovering higher. It climbed above the 23.6% Fib retracement level of the recent decline from the $72.71 high to $69.51 low.
It is now facing resistance near the $70.70 level. The next key resistance is near the $71.10 level. It is near the 50% Fib retracement level of the recent decline from the $72.71 high to $69.51 low. The main resistance is now forming near $71.50 and the 50 hourly simple moving average.
On the downside, an initial support is forming near the $70.00 level. The main support is now forming near the $69.50 level. A downside break below the recent low could open the doors for a move towards the $68.80 support level. Any more losses may possibly lead the price towards the $67.50 support level.
This forecast represents FXOpen Markets Limited opinion only, it should not be construed as an offer, invitation or recommendation in respect to FXOpen Markets Limited products and services or as financial advice.
Trade over 50 forex markets 24 hours a day with FXOpen. Take advantage of low commissions, deep liquidity, and spreads from 0.0 pips. Open your FXOpen account now or learn more about trading forex with FXOpen.
This article represents the opinion of the Companies operating under the FXOpen brand only. It is not to be construed as an offer, solicitation, or recommendation with respect to products and services provided by the Companies operating under the FXOpen brand, nor is it to be considered financial advice.
Latest from Forex Analysis
Latest articles

April Became the Worst Month for BTC/USD Since November 2022
In November 2022, the BTC/USD price dropped by 16.20%. The main driver of this decline was the crash of the FTX exchange.
In April 2024, the price of Bitcoin decreased by 14.77%. Paradoxically, the main news event

USD/JPY Analysis: US Dollar Weakens After Statements from the Federal Reserve Chair
Last night, the Federal Reserve's decision regarding interest rates was published, which, as expected, remained unchanged at 5.5%. The subsequent press conference by Powell was of particular interest to market participants.
According to CNBC, during the conference, the Fed

The Dollar is Declining: the Outcome of the Fed Meeting Disappointed Investors
The outcome of the two-day meeting of the American regulator was that officials left the base interest rate unchanged in the range of 5.25-5.5%. Also, from the published statement, it follows that the Fed is ready to adjust