


FXOpen

Gold price failed to clear the $1,855 resistance and started a fresh decline. Crude oil price is correcting gains and it might test the $57.00 support zone.
Important Takeaways for Gold and Oil
- Gold price started a fresh increase, but it failed near $1,855 and $1,860 resistance levels against the US Dollar.
- There was a break below a major bullish trend line with support near $1,838 on the hourly chart of gold.
- Crude oil price traded to a new multi-month high near $58.75 before correcting lower.
- There was a break below a key bullish trend line with support near $58.20 on the hourly chart of XTI/USD.
Gold Price Technical Analysis
Gold price started a decent recovery wave from the $1,785 zone against the US Dollar. The price climbed above the $1,820 and $1,840 resistance levels.
However, the price struggled to clear the $1,855 and $1,860 resistance levels. A high was formed near $1,855 before the price started a fresh decline. There was a break below the $1,840 level and the 50 hourly simple moving average.
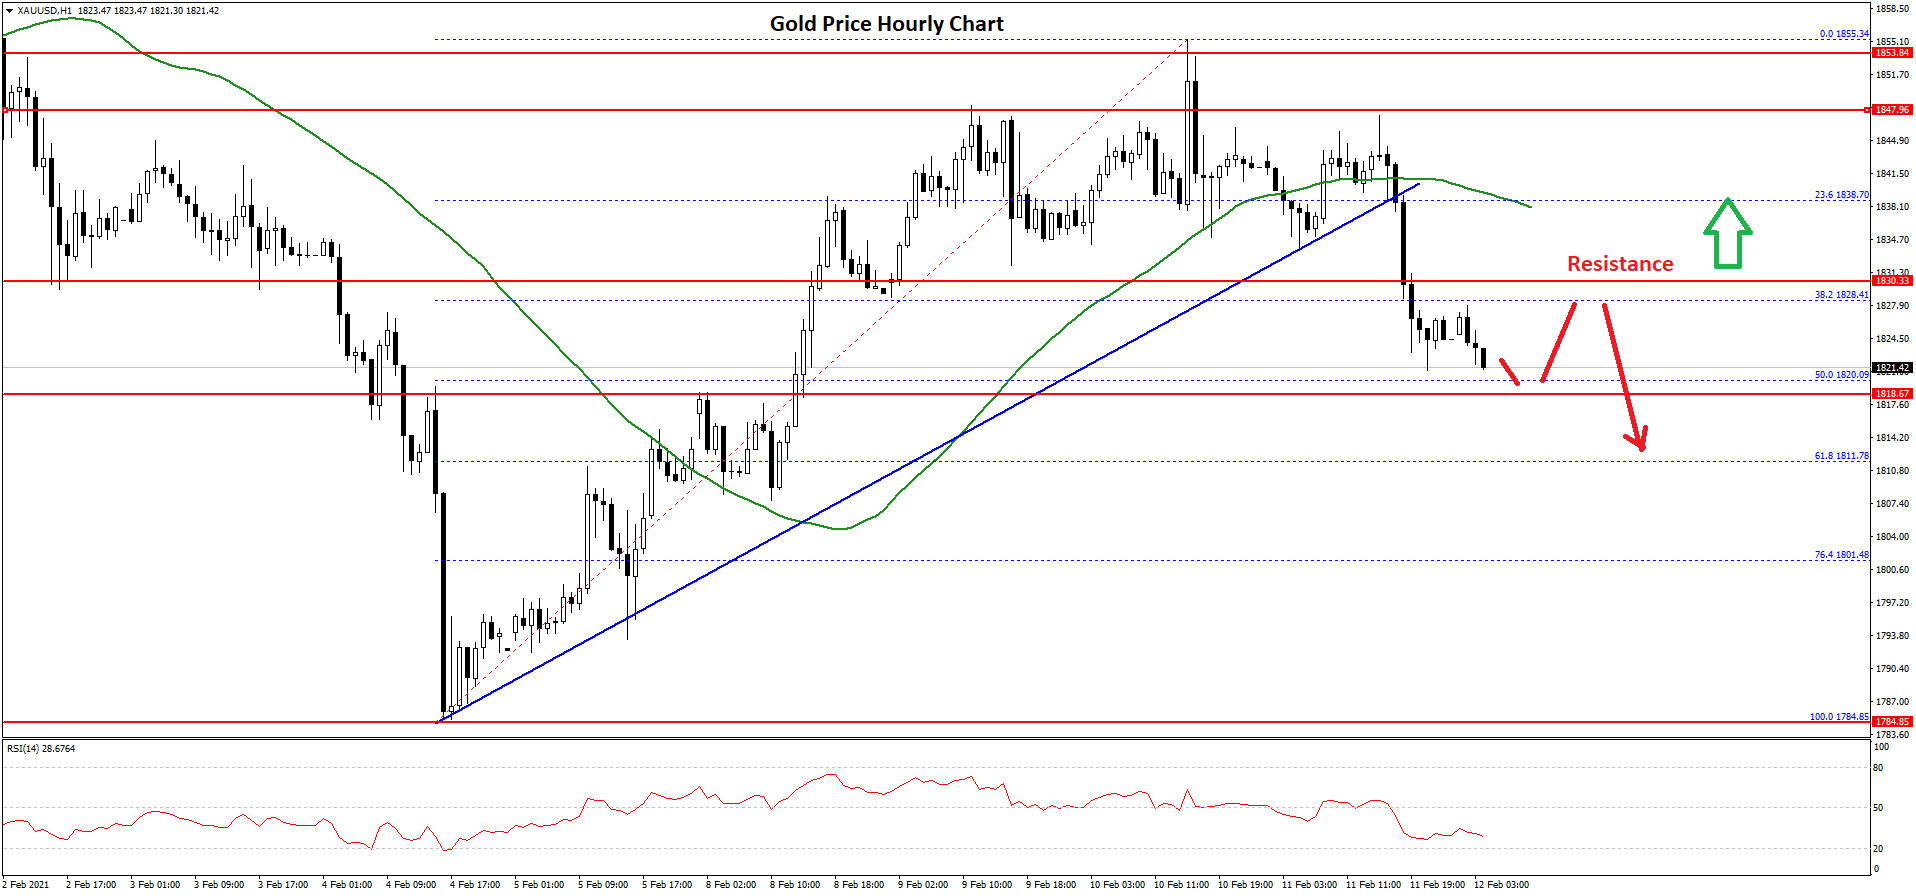
The price traded below the 38.2% Fib retracement level of the upward move from the $1,784 swing low to $1,855 high. There was also a break below a major bullish trend line with support near $1,838 on the hourly chart of gold.
The price is now approaching the $1,820 support zone. The 50% Fib retracement level of the upward move from the $1,784 swing low to $1,855 high is also near the $1,820 level.
If there is a downside break below the $1,820 support level, the price might continue to move down towards the $1,800 level. Any more losses could lead the price towards the $1,784 swing low.
On the upside, the price is likely to face resistance near the $1,830 level. The next major resistance is probably forming near the $1,840 level and the 50 hourly simple moving average.
Oil Price Technical Analysis
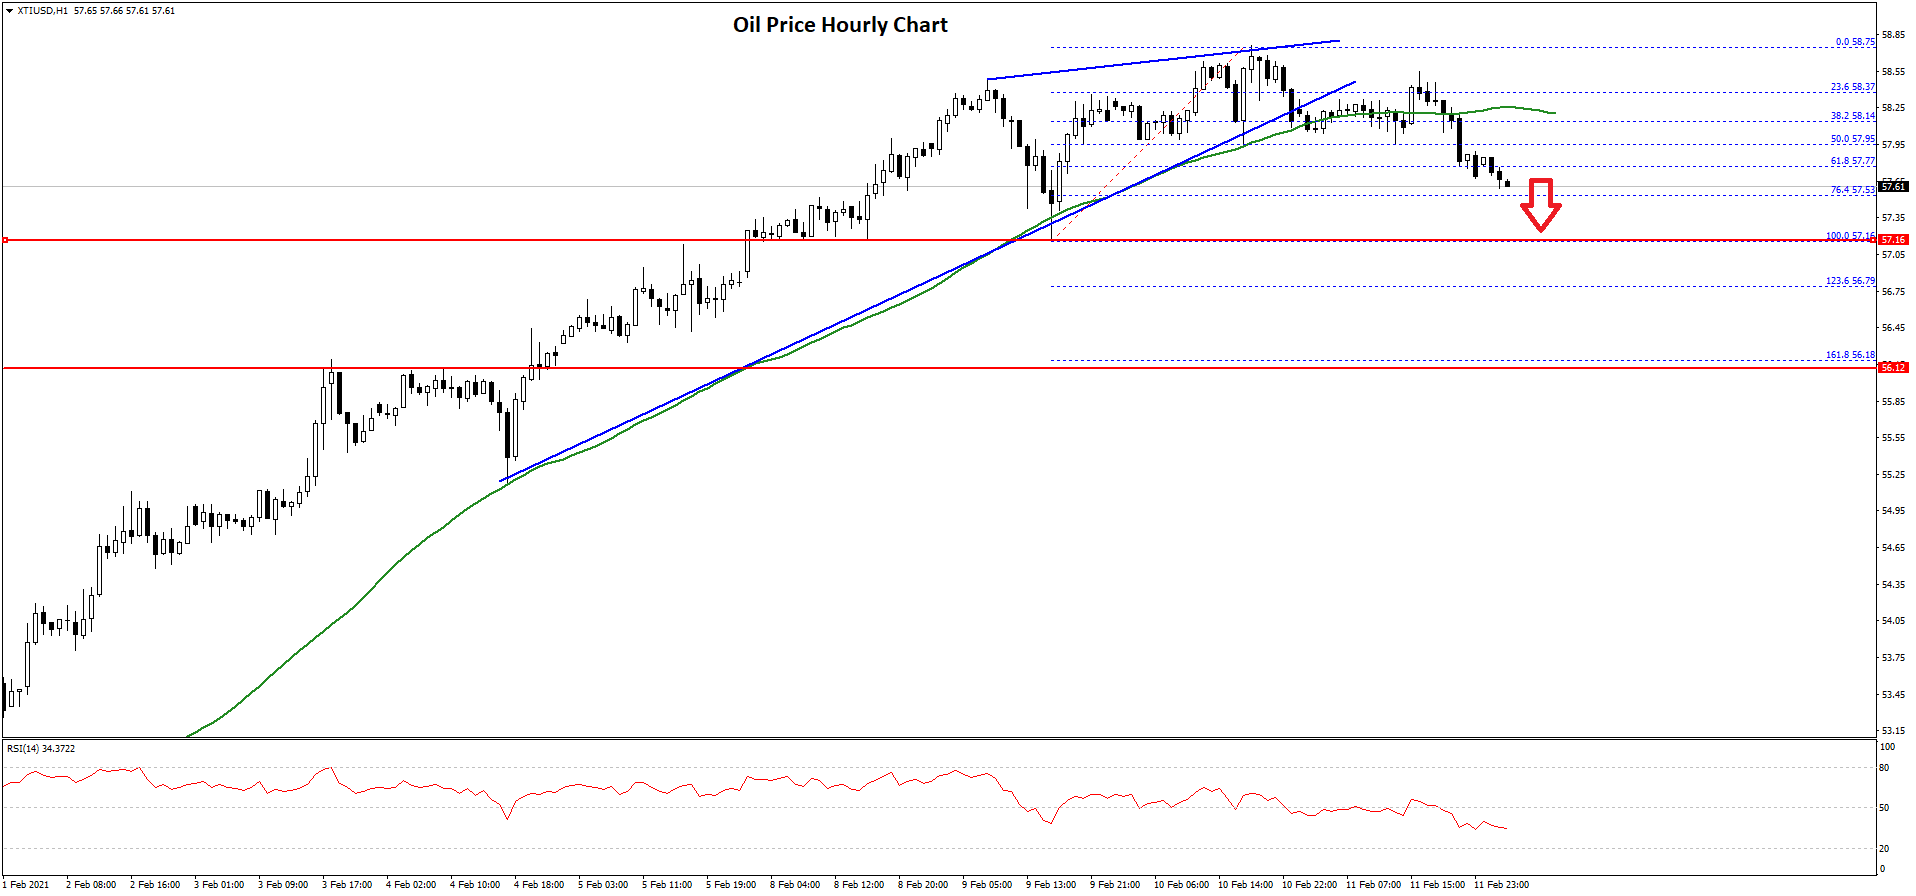
Crude oil price remained in a strong uptrend and settled well above the $55.00 resistance zone against the US Dollar. The price even cleared the $57.50 resistance level and settled well above the 50 hourly simple moving average.
It traded to a new multi-month high near $58.75 before it started a downside correction. There was a break below the $58.40 and $58.20 support levels.
 gold
gold
The price broke the 50% Fib retracement level of the recent upward move from the $57.16 swing low to $58.75 high. There was also a break below a key bullish trend line with support near $58.20 on the hourly chart of XTI/USD.
The price is now approaching the $57.50 support. It is close to the 76.4% Fib retracement level of the recent upward move from the $57.16 swing low to $58.75 high.
The next key support is near the $57.10 level. If the price fails to stay above the $57.10 and $57.00 levels, there are chances of a decline towards the $56.00 support.
On the upside, the $58.20 level and the 50 hourly simple moving average are likely to act as hurdles. The next major resistance is near the $58.50 level, above which the price is likely to continue higher. In the stated case, the bulls could aim a test of the $60.00 level.
Trade over 50 forex markets 24 hours a day with FXOpen. Take advantage of low commissions, deep liquidity, and spreads from 0.0 pips. Open your FXOpen account now or learn more about trading forex with FXOpen.
This article represents the opinion of the Companies operating under the FXOpen brand only. It is not to be construed as an offer, solicitation, or recommendation with respect to products and services provided by the Companies operating under the FXOpen brand, nor is it to be considered financial advice.
Latest from Forex Analysis
Latest articles

What Is a Darvas Box Theory and How Does It Work in Trading?
The Darvas Box Theory, pioneered by Nicolas Darvas in the 1950s, has transcended its stock market origins to become a valuable tool for forex traders. This method leverages specific price movements and patterns, known as the Darvas Box, to track

NFLX Stock Price Falls Despite Subscriber Growth
Yesterday, after the close of the main trading session on the stock market, Netflix reported to investors for the 1st quarter of 2024.
The report turned out better than expected:
→ earnings per share: actual = USD 5.28, forecast = USD 4.

Escalation Between Iran and Israel: How the Price of Brent Oil Reacts
On the night of Thursday into Friday, reports emerged that Israel had attacked Iran following Iran's attack on Israel over the weekend.
Let's remember that we wrote on Monday that after a 300 drone and missile attack on Israel over