


FXOpen

Gold price declined below the $1,880 and $1,860 support levels. Crude oil price is currently rising and it is seems like the bulls are aiming more upsides above $42.00.
Important Takeaways for Gold and Oil
- Gold price started a strong decline below the $1,900 and $1,880 levels against the US Dollar.
- There is a key bearish trend line forming with resistance near $1,870 on the hourly chart of gold.
- Crude oil price stayed above the $39.00 support zone and it is currently trading above $40.00.
- There was a break above a major bearish trend line with resistance near $40.30 on the hourly chart of XTI/USD.
Gold Price Technical Analysis
In the past few days, gold price started a steady decline from well above the $1,950 level against the US Dollar. The price broke many important supports near $1,900 to move into a bearish zone.
The decline gained pace below the $1,900 and $1,880 levels. The price even declined below $1,860 and settled well below the 50 hourly simple moving average. A low is formed near $1,848 on FXOpen and the price is currently correcting higher.
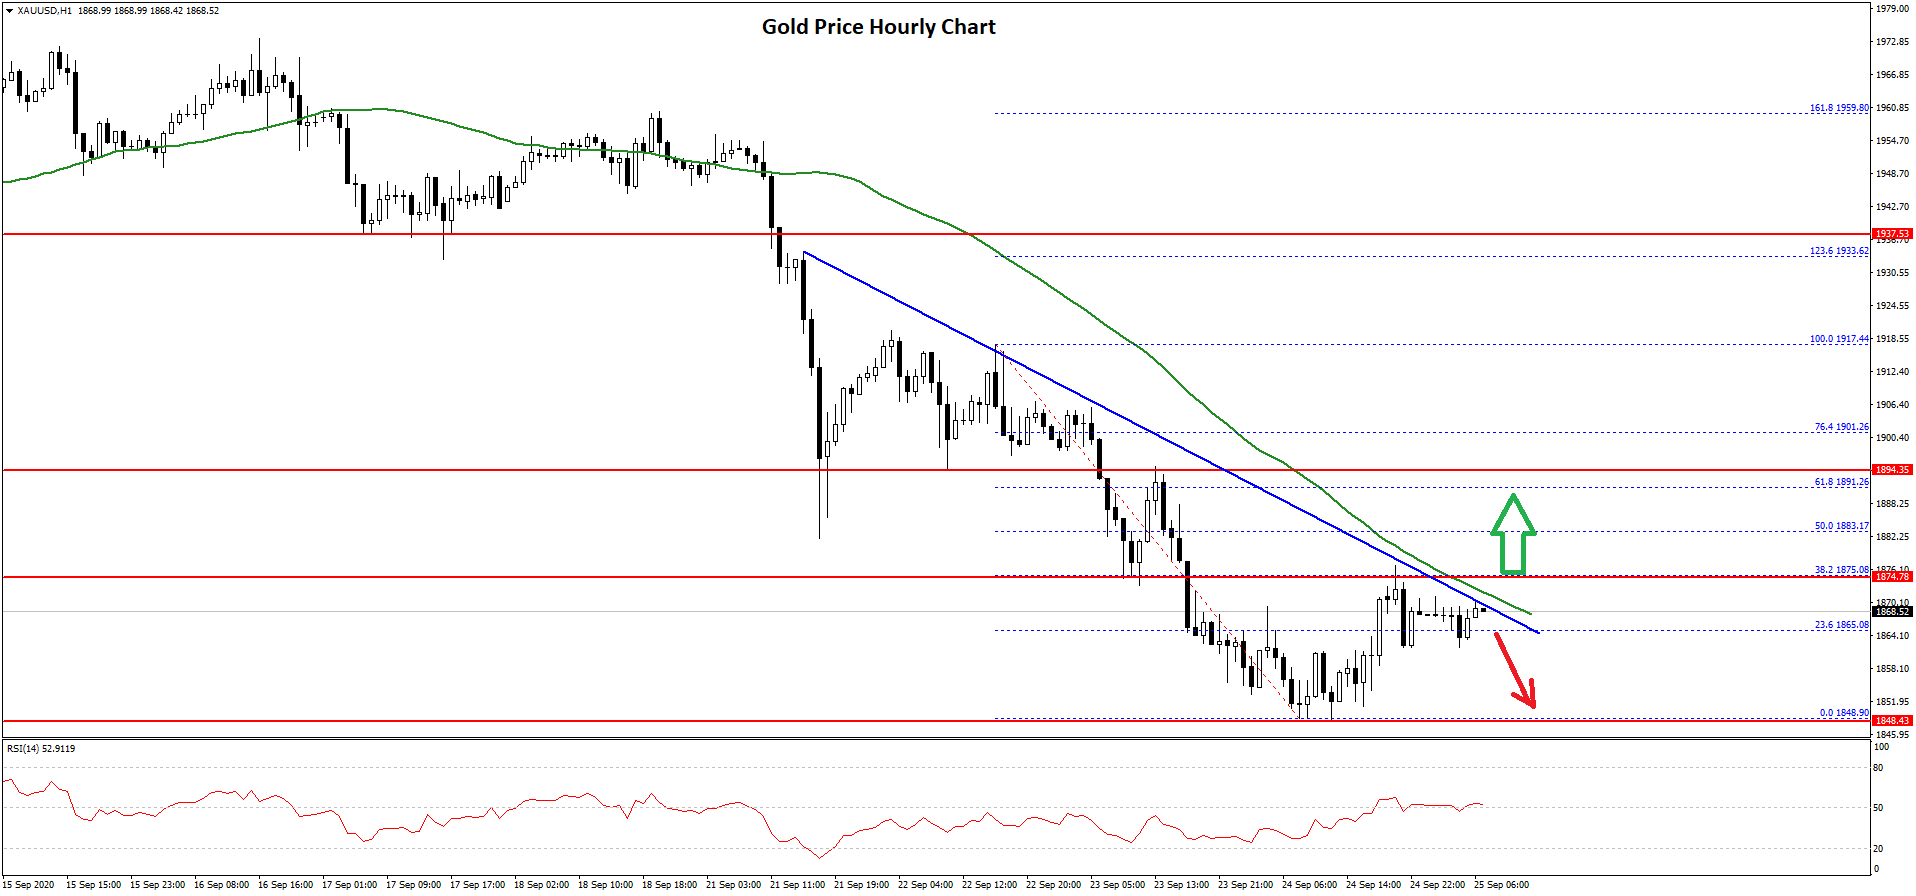
It broke the 23.6% Fib retracement level of the recent decline from the $1,917 high to $1,848 low. The price is now trading near a major hurdle at $1,870.
There is also a key bearish trend line forming with resistance near $1,870 on the hourly chart of gold. Above the trend line, the price might face hurdles near the $1,880 level or the 50% Fib retracement level of the recent decline from the $1,917 high to $1,848 low.
To move into a positive zone, the price must break the $1,880 resistance and then gain pace above the $1,900 resistance zone. Conversely, the price might resume its decline below the $1,860 and $1,850 levels in the near term. The next major support is seen near the $1,820 level.
Oil Price Technical Analysis
Crude oil price climbed higher towards the $42.00 resistance before starting a downside correction against the US Dollar. The price corrected lower below $40.00, but the bulls were able to defend the $39.00 zone.
A swing low is formed near $38.92 and the price is currently rising. It broke the $40.00 resistance area and the 50 hourly simple moving average. Besides, there was a break above the 50% Fib retracement level of the downward move from the $41.71 high to $38.92 low.
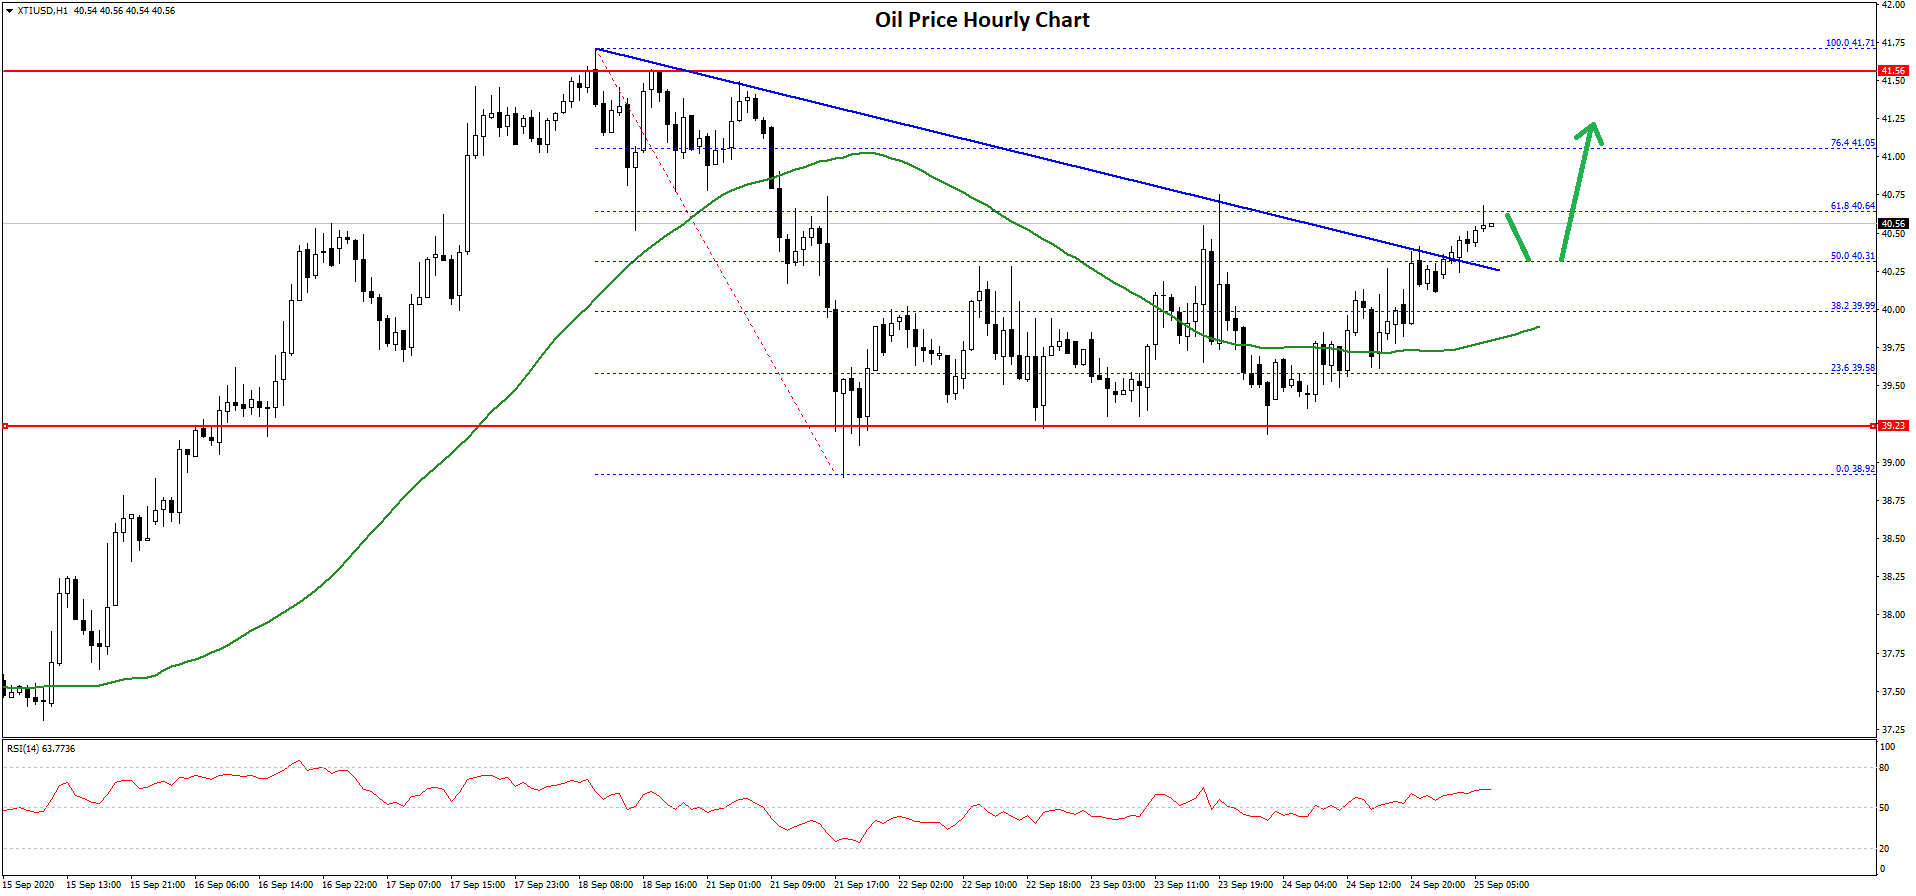
There was also a break above a major bearish trend line with resistance near $40.30 on the hourly chart of XTI/USD. The price is now testing the $40.65 resistance.
The 61.8% Fib retracement level of the downward move from the $41.71 high to $38.92 low is acting as a resistance. A clear break above the $40.65 and $40.80 levels might open the doors for a larger upward move.
The main resistance is near the $42.00 level, above which the bulls might aim a test of the $45.00 resistance in the near term.
Conversely, oil price might decline below the $40.00 support level. The main breakdown support seems to be forming near the $39.00 area. A successful close below the $39.00 level could open the doors for a larger correction towards the $37.50 and $36.00 levels in the near term.
Trade over 50 forex markets 24 hours a day with FXOpen. Take advantage of low commissions, deep liquidity, and spreads from 0.0 pips. Open your FXOpen account now or learn more about trading forex with FXOpen.
This article represents the opinion of the Companies operating under the FXOpen brand only. It is not to be construed as an offer, solicitation, or recommendation with respect to products and services provided by the Companies operating under the FXOpen brand, nor is it to be considered financial advice.
Latest from Forex Analysis
Latest articles

Tech Stocks Back in Vogue as Nasdaq 100 Rallies to Record High
The tech-heavy Nasdaq 100 index (US Tech 100 mini on FXOpen’s TickTrader platform) reached a new all-time high on Monday, closing the trading session at 18,684.2 according to FXOpen pricing, fueled by renewed investor enthusiasm for technology

Gold Price Reaches Historic High
According to confirmed information, Iranian President Ebrahim Raisi, considered a potential successor to the country's supreme leader, Ayatollah Ali Khamenei, died in a helicopter crash in a mountainous area near the border with Azerbaijan. The helicopter also carried Foreign Minister

Commodity Currencies Retreat from Local Highs
Despite the cooling labour market in the US and declining inflation, the American currency continues to move towards new highs. For instance, the USD/JPY currency pair might update the current month's high at 156.70, the NZD/USD sharply