


FXOpen

Gold price declined below the $1,880 and $1,860 support levels. Crude oil price is currently rising and it is seems like the bulls are aiming more upsides above $42.00.
Important Takeaways for Gold and Oil
- Gold price started a strong decline below the $1,900 and $1,880 levels against the US Dollar.
- There is a key bearish trend line forming with resistance near $1,870 on the hourly chart of gold.
- Crude oil price stayed above the $39.00 support zone and it is currently trading above $40.00.
- There was a break above a major bearish trend line with resistance near $40.30 on the hourly chart of XTI/USD.
Gold Price Technical Analysis
In the past few days, gold price started a steady decline from well above the $1,950 level against the US Dollar. The price broke many important supports near $1,900 to move into a bearish zone.
The decline gained pace below the $1,900 and $1,880 levels. The price even declined below $1,860 and settled well below the 50 hourly simple moving average. A low is formed near $1,848 on FXOpen and the price is currently correcting higher.
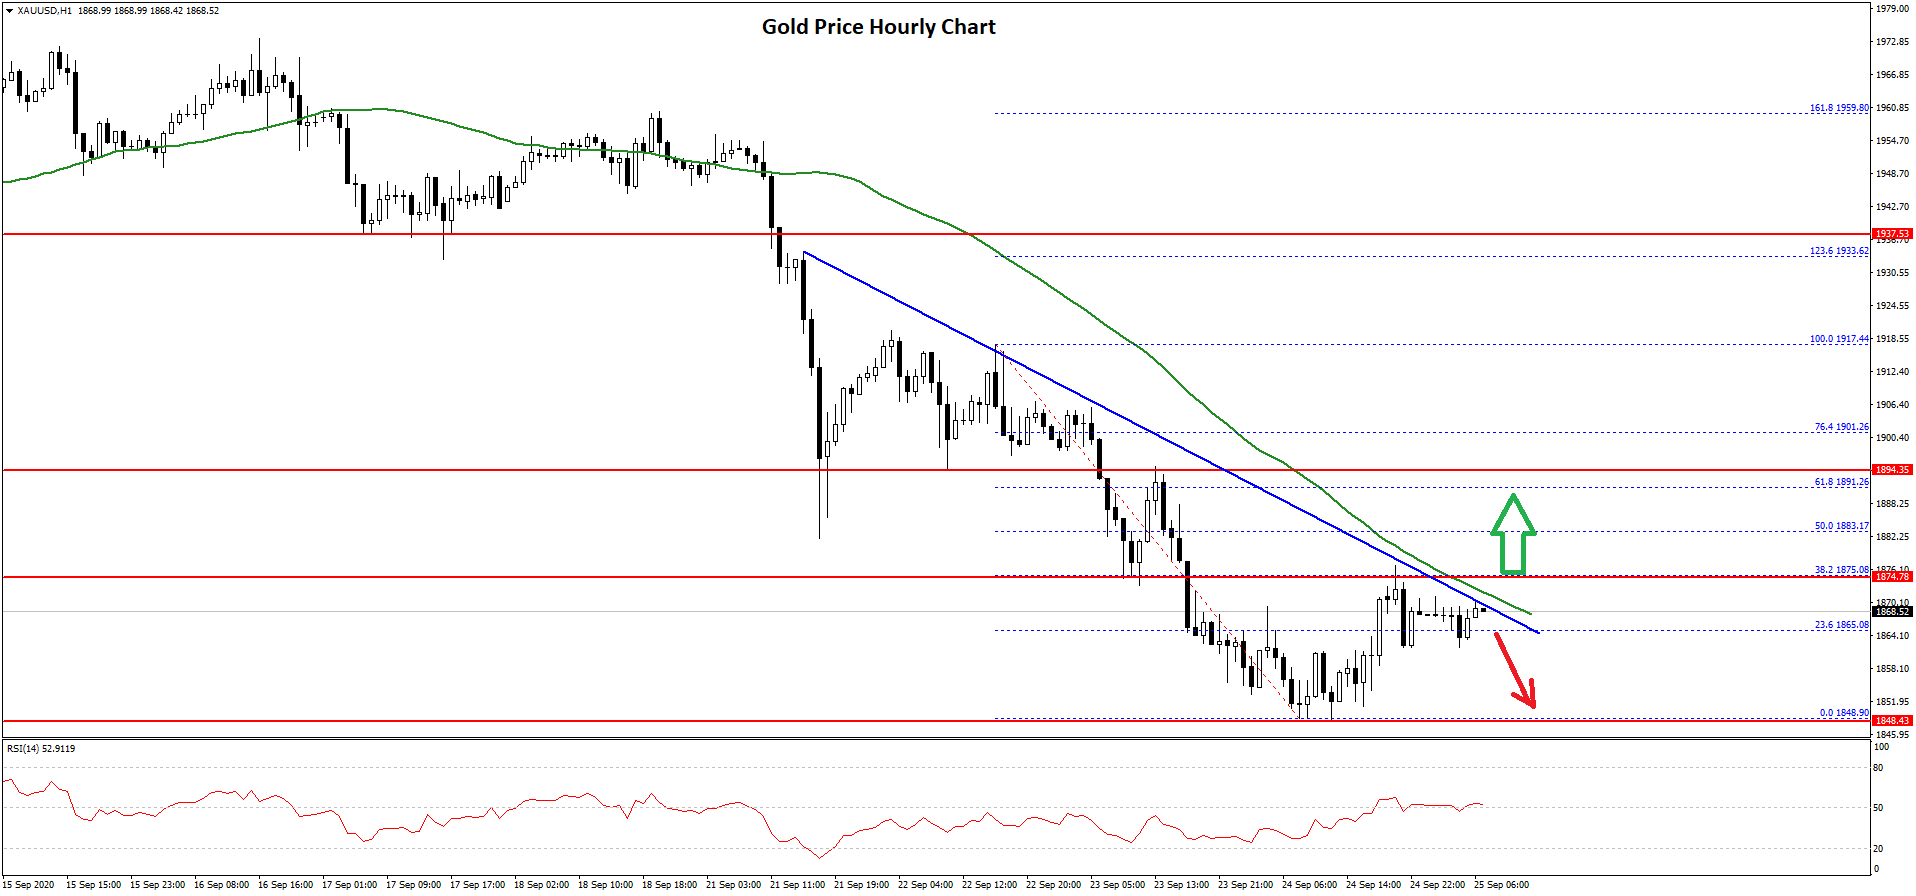
It broke the 23.6% Fib retracement level of the recent decline from the $1,917 high to $1,848 low. The price is now trading near a major hurdle at $1,870.
There is also a key bearish trend line forming with resistance near $1,870 on the hourly chart of gold. Above the trend line, the price might face hurdles near the $1,880 level or the 50% Fib retracement level of the recent decline from the $1,917 high to $1,848 low.
To move into a positive zone, the price must break the $1,880 resistance and then gain pace above the $1,900 resistance zone. Conversely, the price might resume its decline below the $1,860 and $1,850 levels in the near term. The next major support is seen near the $1,820 level.
Oil Price Technical Analysis
Crude oil price climbed higher towards the $42.00 resistance before starting a downside correction against the US Dollar. The price corrected lower below $40.00, but the bulls were able to defend the $39.00 zone.
A swing low is formed near $38.92 and the price is currently rising. It broke the $40.00 resistance area and the 50 hourly simple moving average. Besides, there was a break above the 50% Fib retracement level of the downward move from the $41.71 high to $38.92 low.
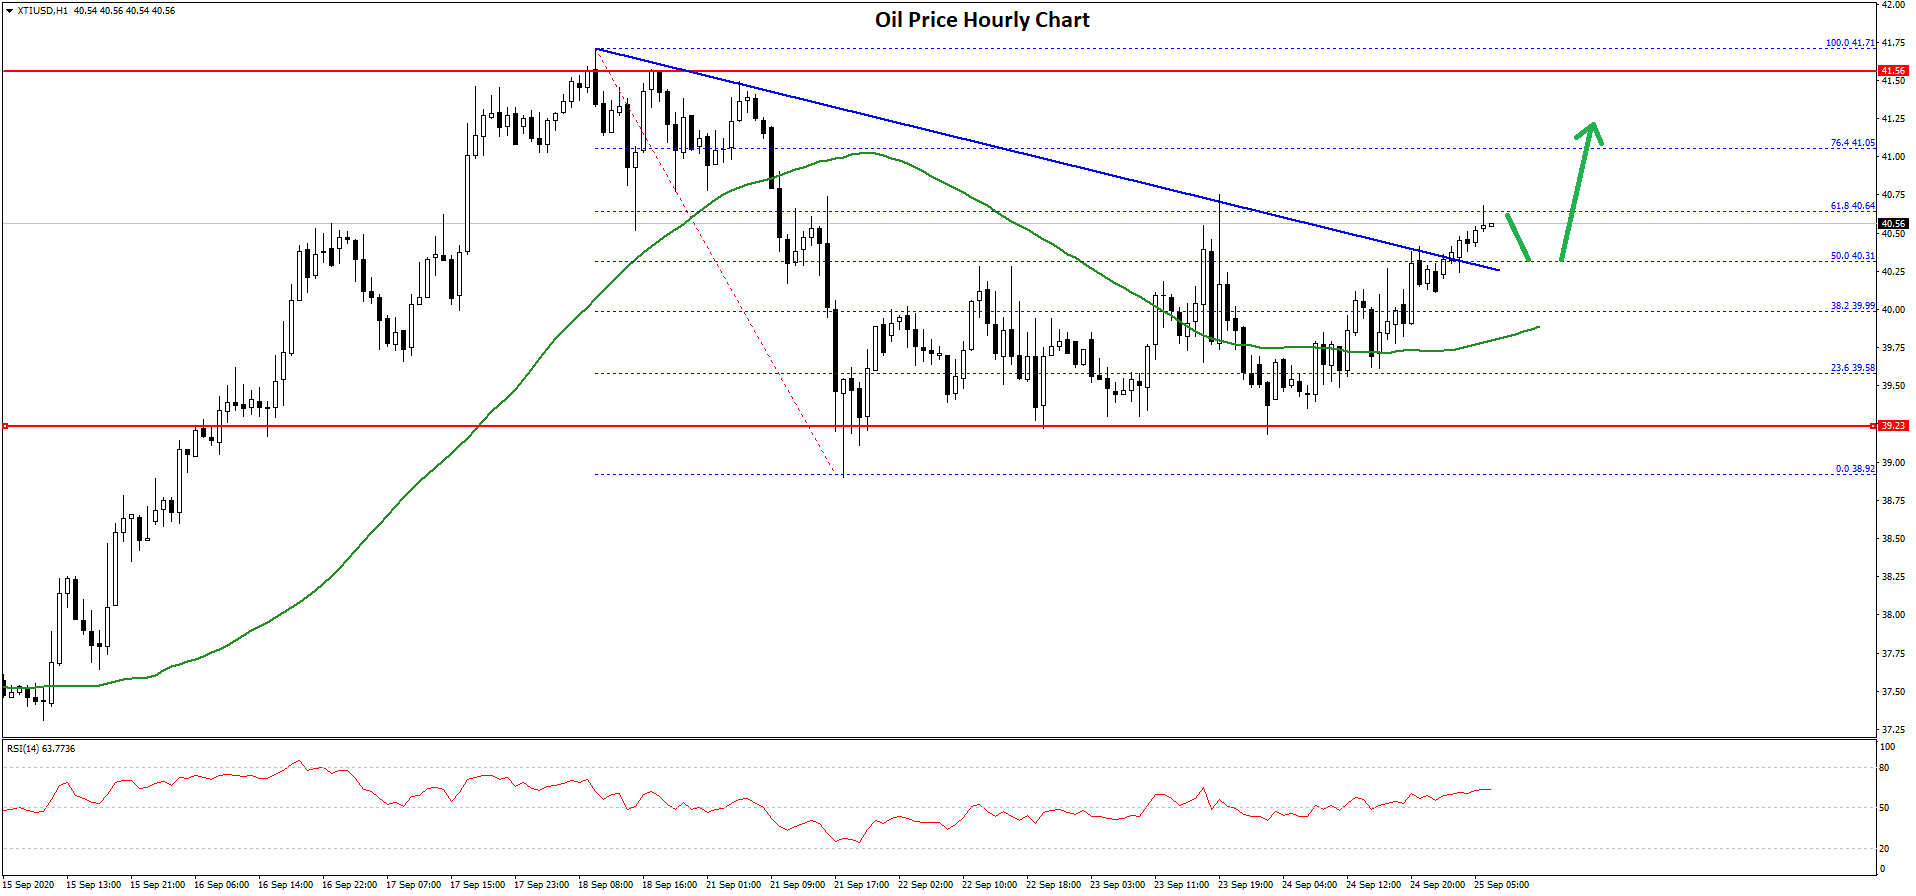
There was also a break above a major bearish trend line with resistance near $40.30 on the hourly chart of XTI/USD. The price is now testing the $40.65 resistance.
The 61.8% Fib retracement level of the downward move from the $41.71 high to $38.92 low is acting as a resistance. A clear break above the $40.65 and $40.80 levels might open the doors for a larger upward move.
The main resistance is near the $42.00 level, above which the bulls might aim a test of the $45.00 resistance in the near term.
Conversely, oil price might decline below the $40.00 support level. The main breakdown support seems to be forming near the $39.00 area. A successful close below the $39.00 level could open the doors for a larger correction towards the $37.50 and $36.00 levels in the near term.
Trade over 50 forex markets 24 hours a day with FXOpen. Take advantage of low commissions, deep liquidity, and spreads from 0.0 pips. Open your FXOpen account now or learn more about trading forex with FXOpen.
This article represents the opinion of the Companies operating under the FXOpen brand only. It is not to be construed as an offer, solicitation, or recommendation with respect to products and services provided by the Companies operating under the FXOpen brand, nor is it to be considered financial advice.
Latest from Forex Analysis
Latest articles

Market Analysis: AUD/USD and NZD/USD Turn Red
AUD/USD declined below the 0.6500 and 0.6455 support levels. NZD/USD is also moving lower and might struggle to recover above 0.5950.
Important Takeaways for AUD/USD and NZD/USD Analysis Today
· The Aussie Dollar started

Since the Start of the Week, Brent Oil Price Has Dropped over 4%
At the beginning of the week, March 15, we wrote that the price of Brent oil could form a correction from the resistance level of USD 91 per barrel. Since then, the price has decreased by more than 4% due

Fair Value Gaps vs Liquidity Voids in Trading
Understanding fair value gaps and liquidity voids is essential for traders seeking to navigate the complexities of the financial markets. These concepts, deeply rooted in the Smart Money Concept (SMC), provide valuable insights into the dynamics of supply and demand,