


FXOpen

Gold price started consolidating in a range above the $1,720 support. Crude oil price is now trading below $60.00 and $60.50 resistance levels.
Important Takeaways for Gold and Oil
- Gold price is trading in a range above the $1,720 support against the US Dollar.
- There are two connecting bearish trend lines forming with resistance near $1,738 on the hourly chart of gold.
- Crude oil price is holding the key $57.50 and $57.40 support levels.
- There is a major bearish trend line forming with resistance near $59.80 on the hourly chart of XTI/USD.
Gold Price Technical Analysis
Gold price made an attempt to surpass the $1,750 resistance against the US Dollar, but it failed. As a result, there was a fresh decline, but the bulls were active above the $1,720 support.
It seems like the price is forming a strong support base above the $1,720 zone. The recent low was formed near $1,722 on FXOpen before the price started an upward move. It broke the 23.6% Fib retracement level of the recent decline from the $1,745 swing high to $1,722 low.
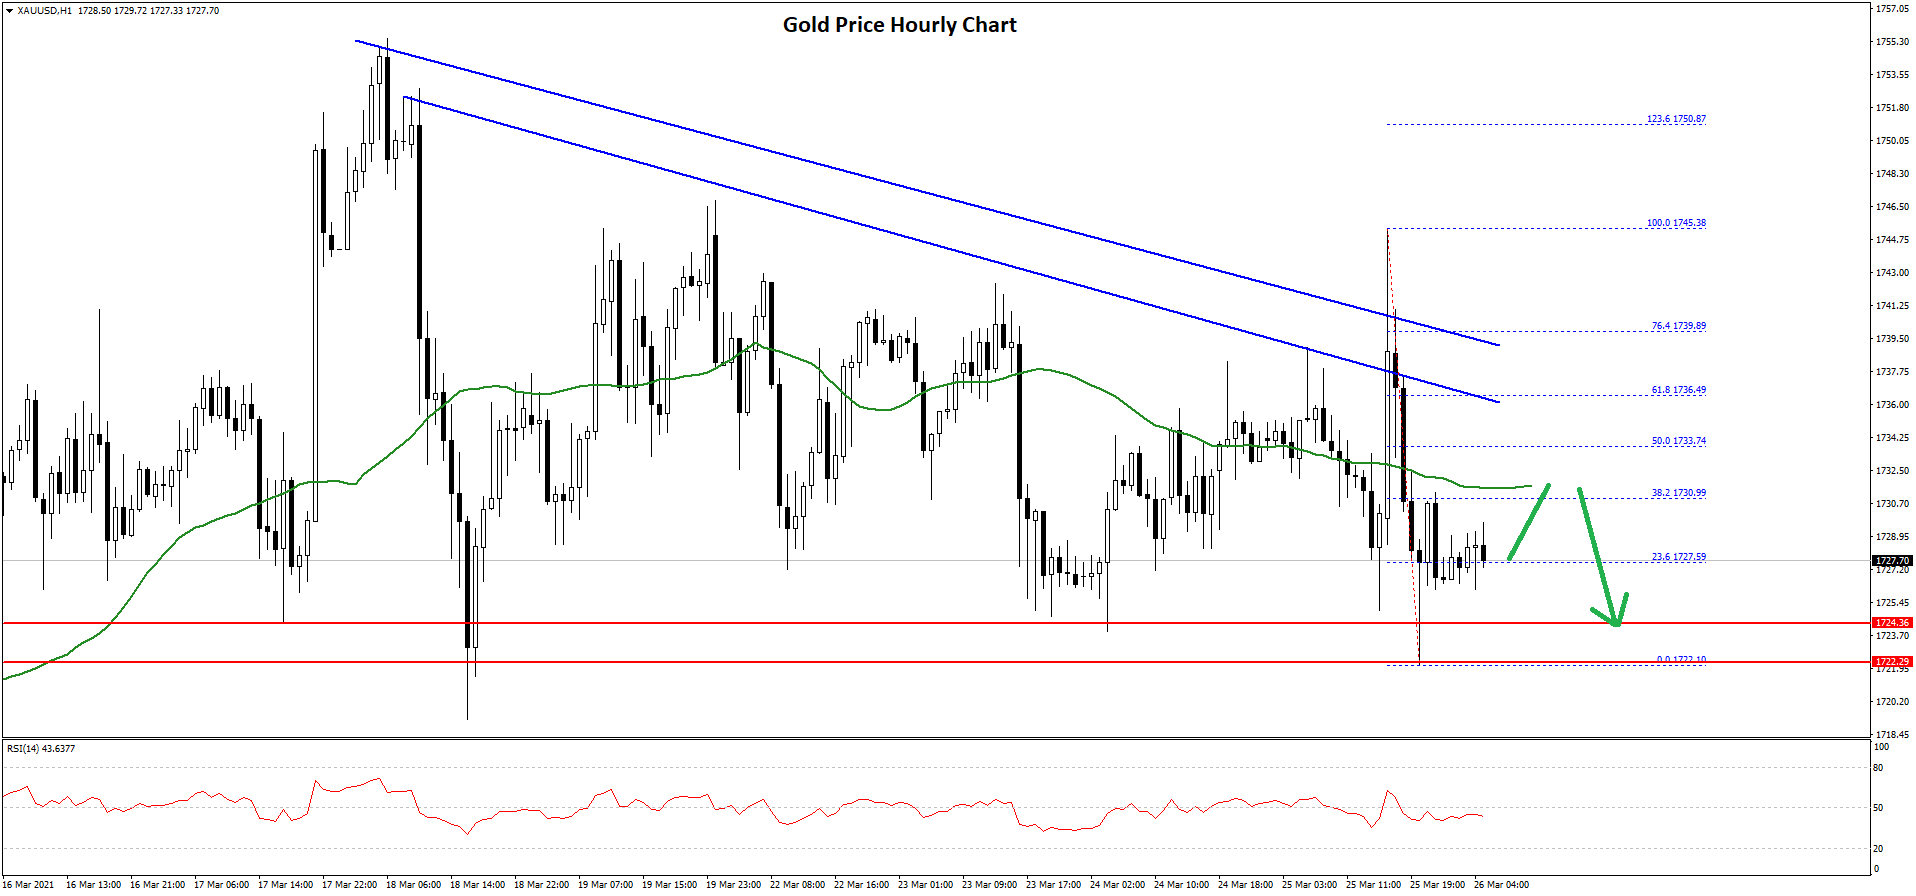
An immediate resistance is near the $1,730 level and the 50 hourly simple moving average. The next key resistance is near the $1,733 level. It is close to the 50% Fib retracement level of the recent decline from the $1,745 swing high to $1,722 low.
There are also two connecting bearish trend lines forming with resistance near $1,738 on the hourly chart of gold. To start a strong increase, the price must clear trend lines and $1,740.
The main resistance is still near $1,750, above which the price could start a strong rally. Conversely, the price could fail to continue higher and it might decline below the $1,725 level.
The main support is near the $1,720 zone. A clear break below the $1,720 support may possibly start a strong decline towards $1,700 or even $1,680 in the near term.
Oil Price Technical Analysis
Crude oil price failed to stay above the $63.50 level and started a fresh decline against the US Dollar. The price broke the $62.00 support zone to move into a short-term bearish zone.
The price even broke the $60.50 and $60.00 support levels. The bears pushed the price towards the $57.00 zone. The recent low was formed near $57.42 and the price is currently correcting higher.
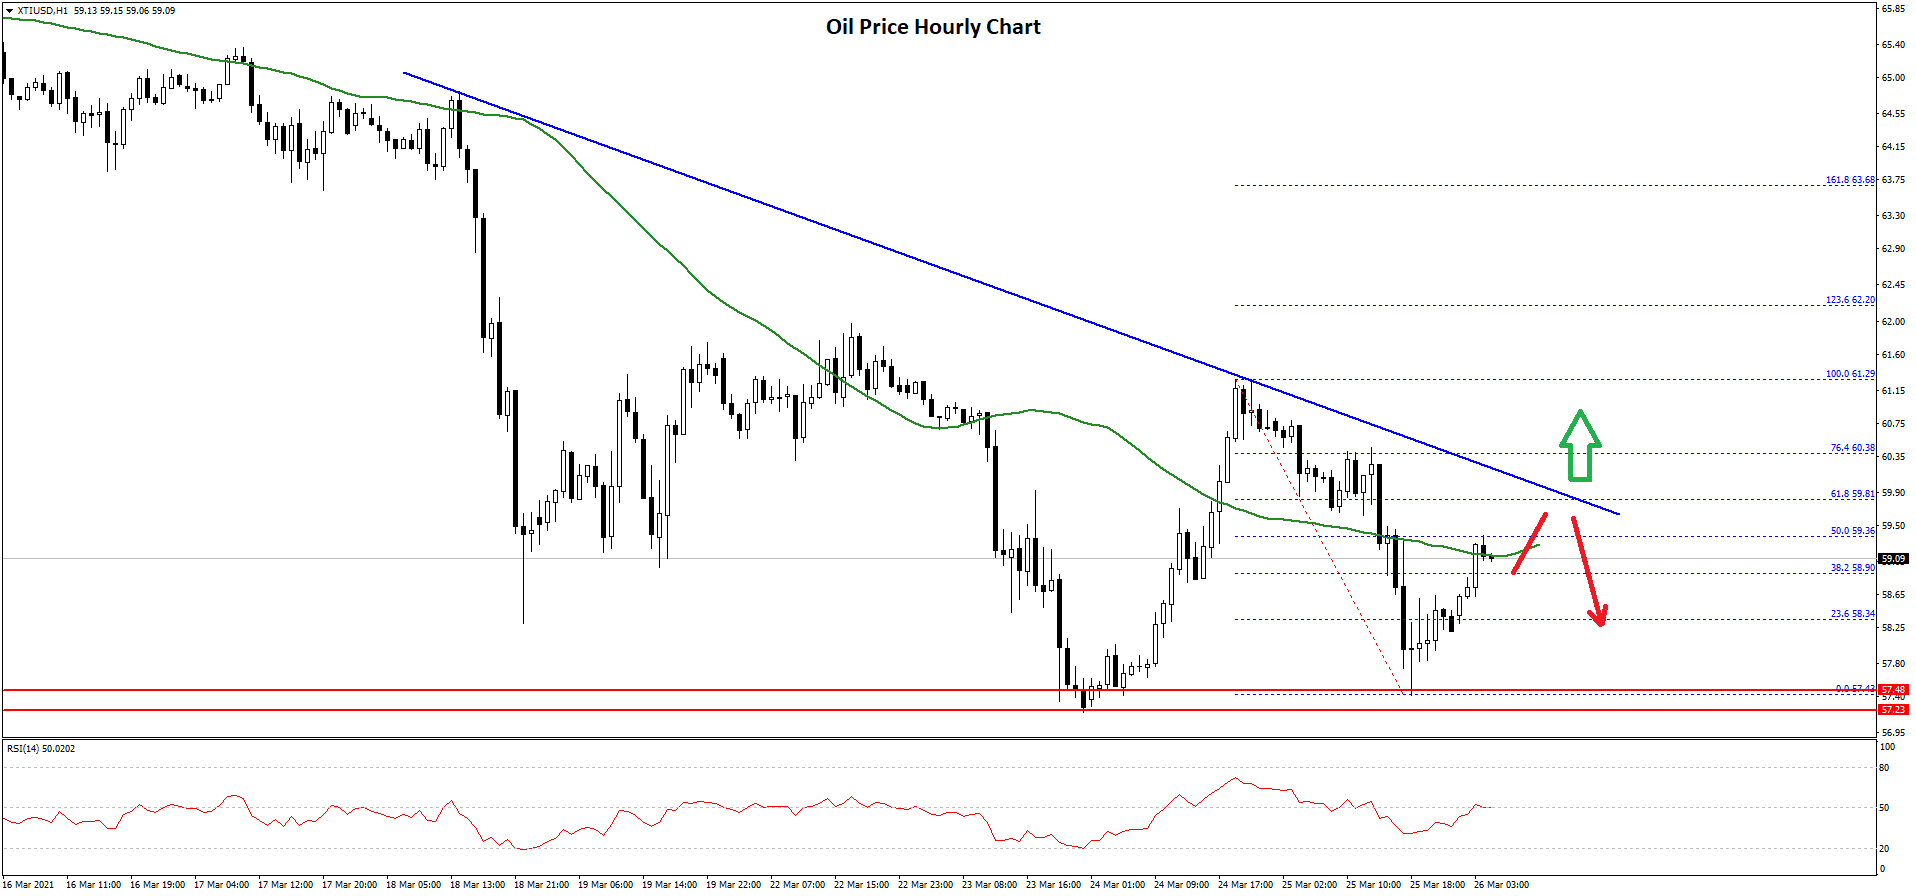
There was a break above the $58.00 and $58.20 resistance levels. The price corrected above the 38.2% Fib retracement level of the recent decline from the $61.29 high to $57.42 low. However, the price seems to be facing resistance near $59.30 and the 50 hourly simple moving average.
The 50% Fib retracement level of the recent decline from the $61.29 high to $57.42 low is also near the $59.36 level. There is also a major bearish trend line forming with resistance near $59.80 on the hourly chart of XTI/USD.
If there is an upside break above $59.30 and then $59.80, the price could resume its increase towards $61.50 and $62.00. The next major resistance is near the $63.50 level.
Conversely, the price might fail to recover above $60.00 and it could start a fresh decline. An initial support is near the $58.20 level. The next major support is near the $57.40 level, below which the price might test $55.00.
Trade over 50 forex markets 24 hours a day with FXOpen. Take advantage of low commissions, deep liquidity, and spreads from 0.0 pips. Open your FXOpen account now or learn more about trading forex with FXOpen.
This article represents the opinion of the Companies operating under the FXOpen brand only. It is not to be construed as an offer, solicitation, or recommendation with respect to products and services provided by the Companies operating under the FXOpen brand, nor is it to be considered financial advice.
Latest from Forex Analysis
Latest articles

Is There the Best Time to Trade Stock CFDs?
If you ask experienced traders, many will say that they trade on certain days or at certain times of the day. Their choice is determined by the market dynamics, volatility, and liquidity. It’s crucial to understand when the best

UnitedHealth (UNH) Share Price Surges after Strong Report
UnitedHealth shares surged Tuesday, rising more than 5% after the health care giant delivered stronger-than-expected first-quarter 2024 results:
→ earnings per share: actual = USD 6.91, expected = USD 6.61, last quarter = USD 6.16;
→ gross income: actual = USD 94.4

USD/JPY Analysis: Prospect of a Breakout of the Level of 155 Yen per Dollar
The USD/JPY rate has consistently reached new highs since 1990, approaching the psychological level of 155 yen per US dollar. The Japanese currency has already fallen about 9% against the dollar this year.
This is supported by Jerome Powell,