


FXOpen

Gold price started a downside correction after surging towards $1,960. Conversely, crude oil price is following a strong bullish path and it settled above $50.00.
Important Takeaways for Gold and Oil
- Gold price started a fresh increase towards $1,950-$1,960 and recently corrected lower against the US Dollar.
- There was a break below a major bullish trend line with support near $1,920 on the hourly chart of gold.
- Crude oil price surged above the $48.00 resistance and it even broke the $50.00 barrier.
- There is a key rising channel forming with support near $50.60 on the hourly chart of XTI/USD.
Gold Price Technical Analysis
Gold price started a fresh increase above the $1,910 resistance level against the US Dollar. The price broke the $1,925 and $1,950 resistance levels to move into a positive zone.
The price even traded close to the $1,960 before it faced sellers. A swing high was formed near $1,959 on FXOpen before the price started a downside correction. There was a sharp decline below the $1,950 and $1,940 levels.
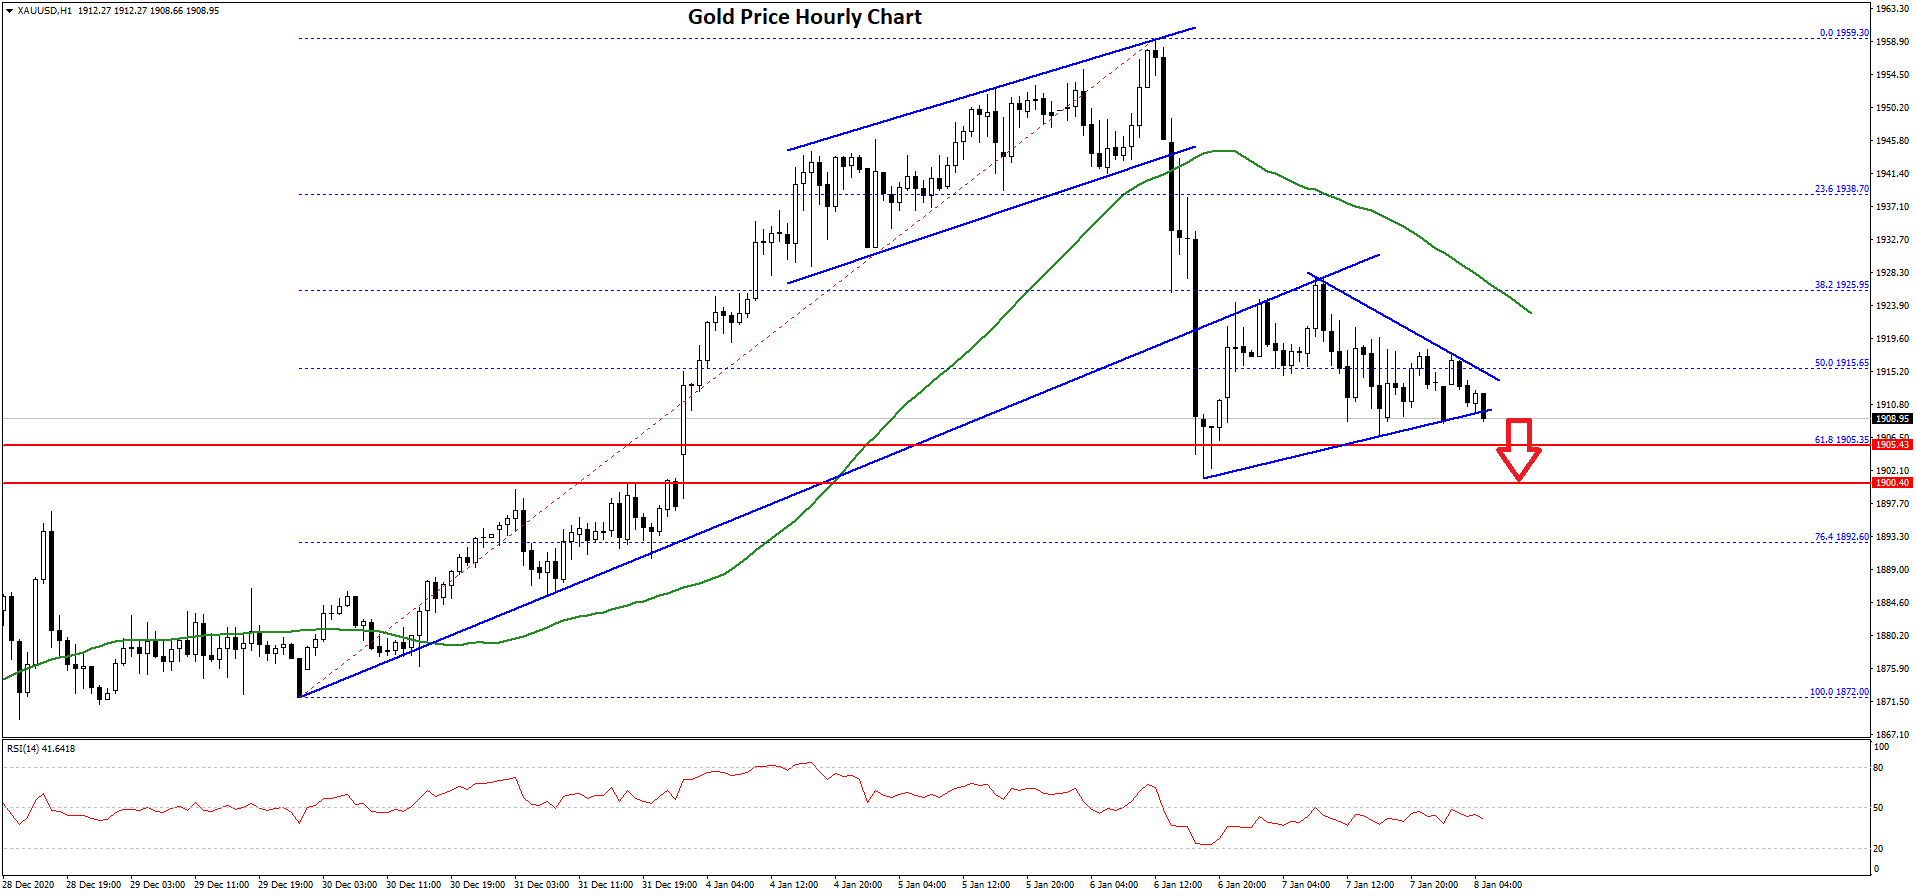
During the decline, there was a break below a major bullish trend line with support near $1,920 on the hourly chart of gold. The price traded below the 50% Fib retracement level of the upward move from the $1,872 swing low to $1,959 high.
It even settled below the $1,920 level and the 50 hourly simple moving average. It seems like the price is approaching the $1,905 and $1,900 support levels. The 61.8% Fib retracement level of the upward move from the $1,872 swing low to $1,959 high might also provide support.
Any more losses could lead the price towards the $1,880 support level. Conversely, the price could attempt a fresh increase above the $1,915 and $1,920 resistance levels.
A successful close above the $1,920 and the 50 hourly simple moving average could open the doors for a decent increase in the coming sessions. The next major resistance is near the $1,950 level.
Oil Price Technical Analysis
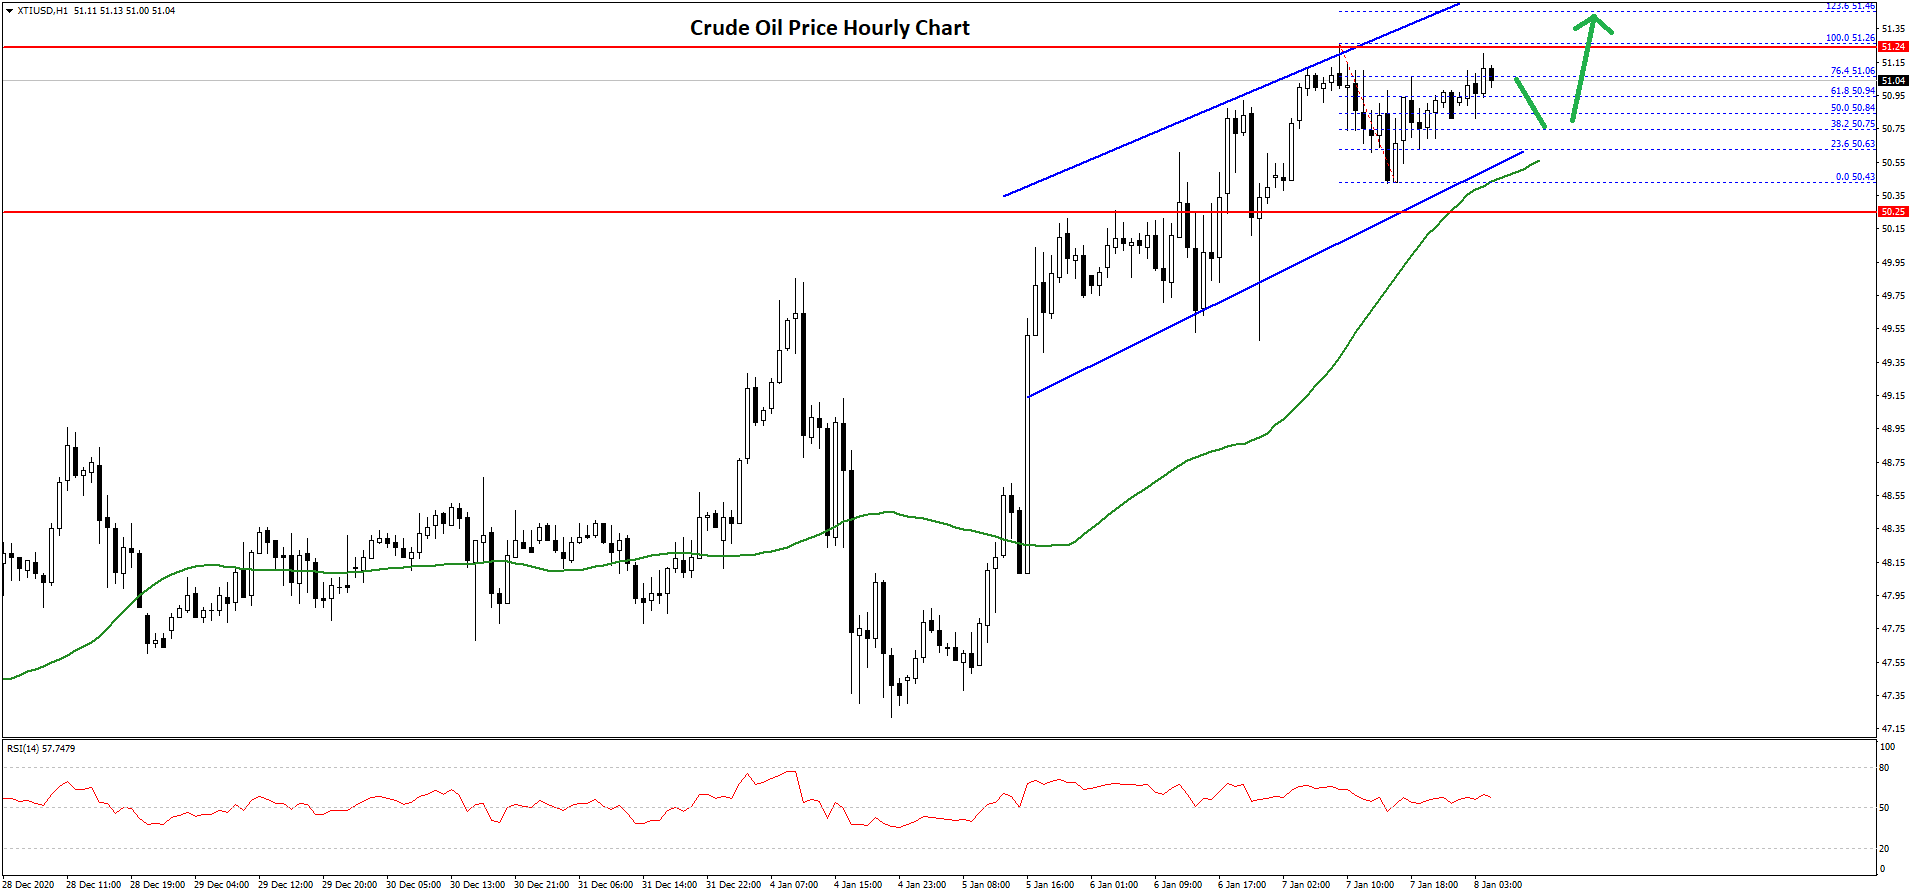
Crude oil price started a steady rise after it broke the key $48.00 resistance zone against the US Dollar. The price broke many hurdles near $50.00 to move further into a positive zone.
The price even broke the $51.00 level and settled above the 50 hourly simple moving average. It traded to a new multi-month high near $51.26 before starting a downside correction. It declined towards $50.50 level and it is currently rising.
 gold
gold
There was a break above the $50.80 resistance. The price recovered above the 50% Fib retracement level of the recent decline from the $51.26 high to $50.43 low.
It is now trading above the 76.4% Fib retracement level of the recent decline from the $51.26 high to $50.43 low. Therefore, there are high chances of a break above the $51.20 and $51.50 resistance levels in the coming sessions.
On the downside, an initial support is near the $50.80 level. There is also a key rising channel forming with support near $50.60 on the hourly chart of XTI/USD.
If there is a downside break below the channel support trend line, the price could decline towards the $50.00 support level. The next major support sits near the $49.55 level.
Trade over 50 forex markets 24 hours a day with FXOpen. Take advantage of low commissions, deep liquidity, and spreads from 0.0 pips. Open your FXOpen account now or learn more about trading forex with FXOpen.
This article represents the opinion of the Companies operating under the FXOpen brand only. It is not to be construed as an offer, solicitation, or recommendation with respect to products and services provided by the Companies operating under the FXOpen brand, nor is it to be considered financial advice.
Latest from Forex Analysis
Latest articles

Moderna goes AI and experiences share price rally
It has been a few years now since the word Moderna was heard, or read, several times per day and as with many periods of time in which a previously headline-dominating phenomenon subsides, the pharmaceutical giant's seemingly continuous media coverage

USD to CAD Analytical Predictions in 2024, 2025 and Beyond
This comprehensive article delves into the intricacies of the USD to CAD exchange rate, exploring the factors that may influence its trajectory in 2024, 2025, and beyond. From economic outlooks to key market drivers, this article provides valuable insights for

France Joins European Stock Boom as CAC 40 Index Heads for Highs
This decade has been full of market-disrupting surprises, placing it as completely different to any other decade experienced by residents of Western Europe and North America since the end of the Second World War.
The only constant dynamic since the