


FXOpen
The price of gold surged to the highest level in more than one-year, increasing the yellow metal to over $1260 an ounce after the release of back to back downbeat economic data from the United States. The technical bias remains bullish because of a Higher High in the ongoing rally.
Technical Analysis
As of this writing, the yellow metal is being traded near $1261 an ounce. A hurdle may be noted near $1268, the intraday high of yesterday ahead of $1300, the psychological number and then $1307, the swing high of the last major upside rally as demonstrated in the following daily chart.
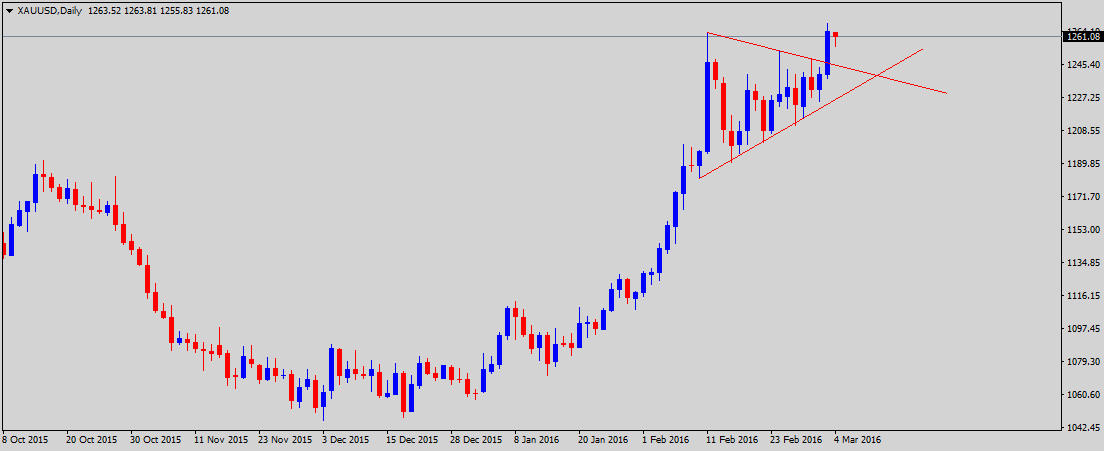
On the downside, the metal is likely to find a support around $1245 an ounce, the trendline support ahead of 1190-1200, the confluence of psychological number as well as swing low of the last major downside move. The technical bias will remain bullish as long as the 1190 support area is intact.
US Factory Orders
Orders to U.S. factories increased in January by the most in seven months, while a key category that tracks business investment plans rose by the largest amount in 19 months. Factory orders rose 1.6 percent in January after two months of declines, the Commerce Department reported Thursday. It was the biggest jump since June, though it was driven by demand in the volatile category of commercial aircraft. At the same time, orders in a core sector that reflects business investment rose 3.4 percent — the sharpest one-month gain since June 2014.
Trade Idea
Considering the overall technical and fundamental outlook, selling the precious metal around current levels appears to be a good strategy in short to medium term if we get a valid bearish reversal candle on the daily chart.
Trade over 50 forex markets 24 hours a day with FXOpen. Take advantage of low commissions, deep liquidity, and spreads from 0.0 pips. Open your FXOpen account now or learn more about trading forex with FXOpen.
This article represents the opinion of the Companies operating under the FXOpen brand only. It is not to be construed as an offer, solicitation, or recommendation with respect to products and services provided by the Companies operating under the FXOpen brand, nor is it to be considered financial advice.
Latest from Forex Analysis
Latest articles

Google Share Price Rose Post-market to a New All-time Record
Yesterday, after the close of the main trading session, a report on activities for the 1st quarter of Alphabet Inc. (Google's parent company) was published. The report was strong, exceeding investors' expectations.
→ Quarterly EPS = USD 1.89 (expected = USD 1.

S&P 500 Rebounds after Negative GDP News
Data released yesterday showed US GDP growth slowed to 1.6% in the first quarter of the year. According to ForexFactory: forecast = 2.2%, past value = 2.4%.
Reaction to the news sent the S&P 500 mini stock

GBP/USD And USD/CAD Daily Chart Outlook
GBP/USD is attempting a recovery wave from 1.2300. USD/CAD is consolidating and might aim for a move above the 1.3760 resistance zone.
Important Takeaways for GBP/USD and USD/CAD Analysis Today
· The British Pound started