


FXOpen

LTC/USD
The price of Litecoin has been in a decline since Tuesday when it was sitting at $166.11 and made a downfall to $130 level today, which was a decrease of 21.74%. Now the price is being traded slightly higher but is still in a downward trajectory.
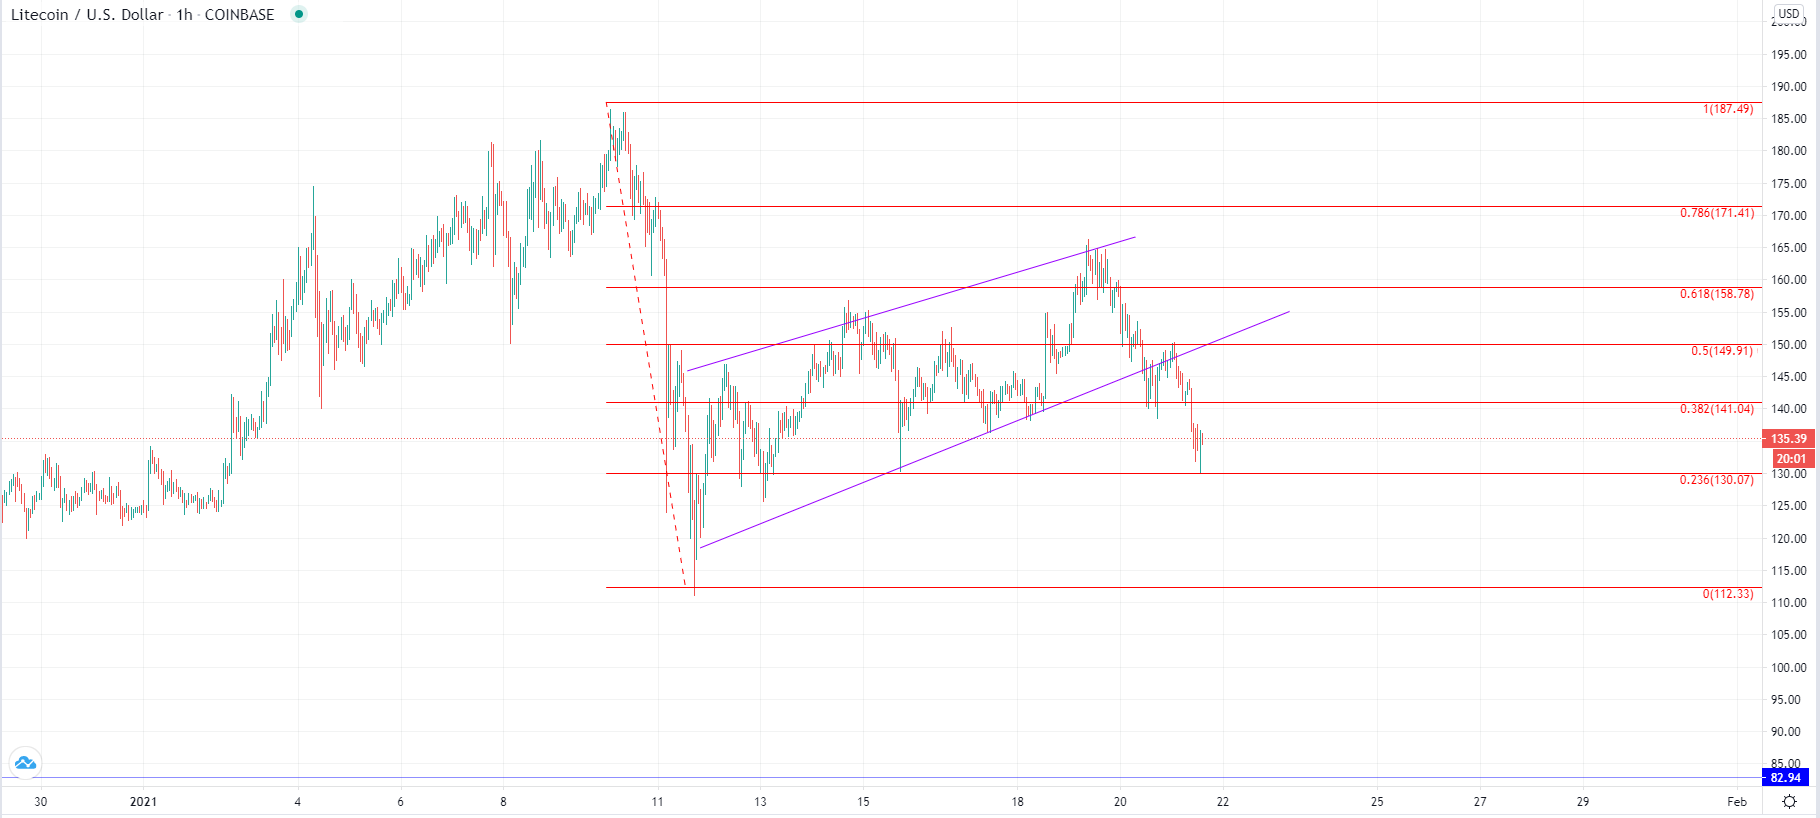
Looking at the hourly chart, you can see that the price made a breakout below the ascending channel that formed since the 11th of January when the price fell to the $112.33 area. From there a recovery was made all the way up above the $160 level but now another impulsive descending move has been seen which is most likely the continuation of the corrective decrease. If this is the three-wave corrective decline from the 10th of January the move to the downside would be expected to continue and surpass the prior low at $112 and could potentially continue all the way down to $82.9.
However, there is a possibility that this is going to be a triangle formation of the higher degree in which this three-wave move could be its first sub-wave. In that case, the price could make another significant recovery before this move to the $82.9 horizontal level. The price has found support at 0.236 Fib level at least a temporary one, so now we are going to see what happens as if it manages to stay up the recovery might come.
EOS/USD
From its Tuesday’s high at $2.926 the price of EOS has decreased by 12.18% as it came down to $2.579 at its lowest wick today. Now the price is looking like it has stabilized above the $2.62 level and is establishing support.
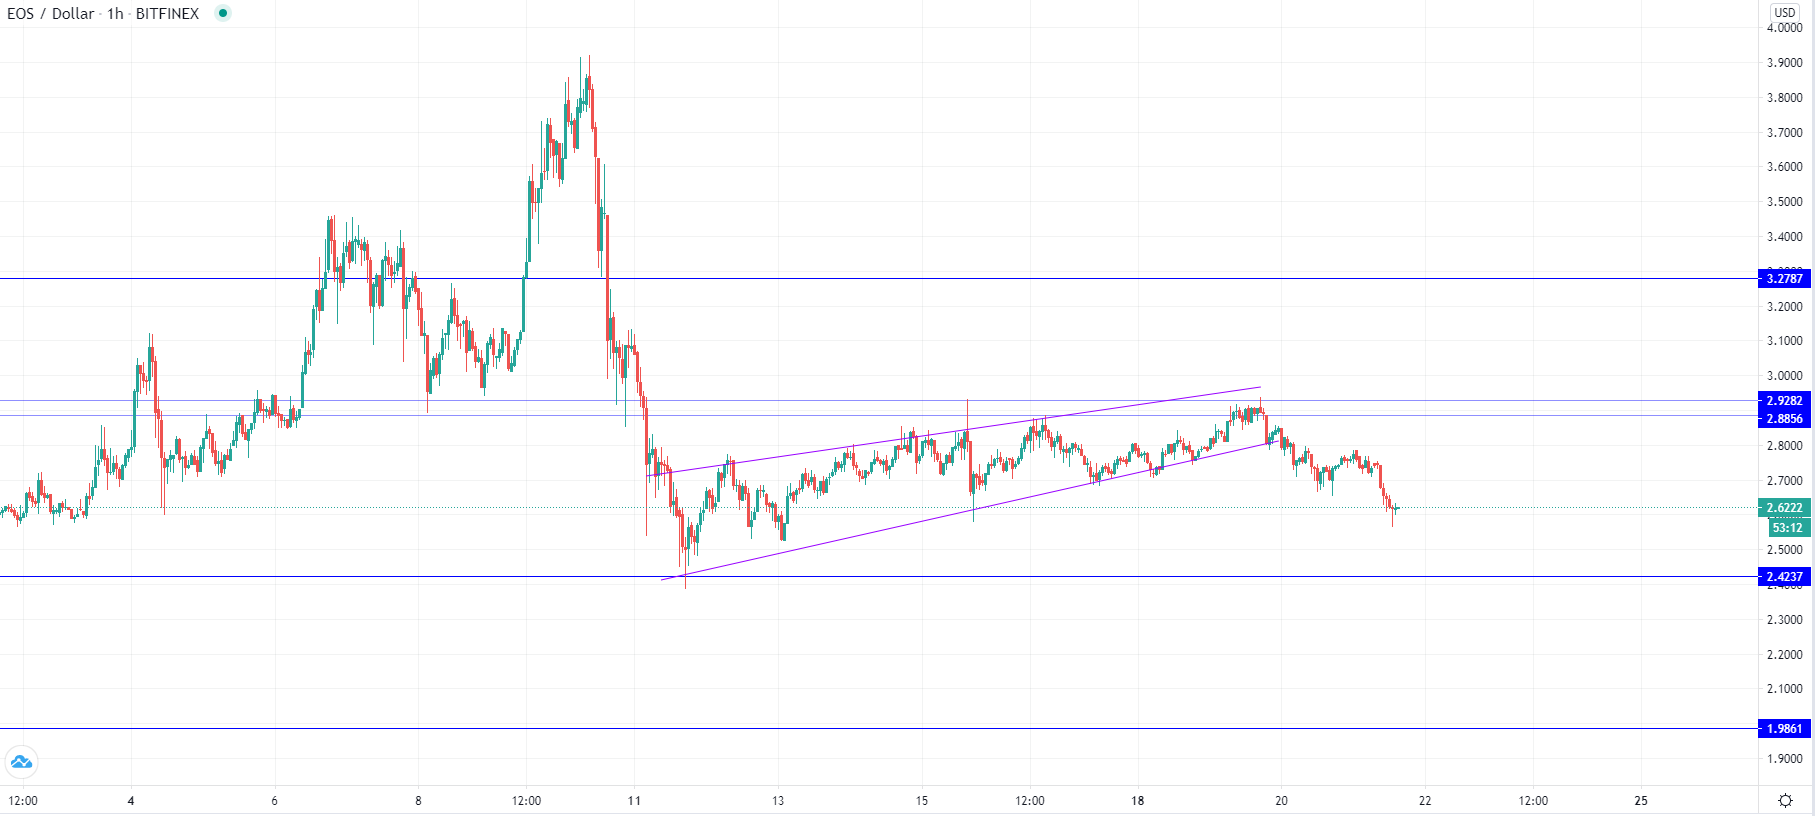
On the hourly chart, you can see that the price has made a breakout from the ascending channel like in the case of Litecoin but the pattern isn’t as similar as the price of EOS made a more significant decrease from the 10th of January till the 11th then it has now since Tuesday. We have seen a decrease of over 37% till the 11th of January and if this descending move is the continuation of that move, the price could be expected to go significantly lower. But another round of hard-selling like it occurred then isn’t likely to play out.
More likely we are going to see a further decrease to some of the horizontal support levels out of which the first one in line would be the 11th January low, but the next one is just below the $2 mark. The price could make another impulsive move to the vicinity of the lower horizontal level, but like in the case of Litecoin that might not come in a straight line.
FXOpen offers the world's most popular cryptocurrency CFDs*, including Bitcoin and Ethereum. Floating spreads, 1:2 leverage — at your service. Open your trading account now or learn more about crypto CFD trading with FXOpen.
*At FXOpen UK and FXOpen AU, Cryptocurrency CFDs are only available for trading by those clients categorised as Professional clients under FCA Rules and Professional clients under ASIC Rules respectively. They are not available for trading by Retail clients.
This article represents the opinion of the Companies operating under the FXOpen brand only. It is not to be construed as an offer, solicitation, or recommendation with respect to products and services provided by the Companies operating under the FXOpen brand, nor is it to be considered financial advice.
Latest articles

Weekly Market Wrap With Gary Thomson: S&P500, US Dollar, Gold Price, PEP Stocks
Get he latest scoop on the week's hottest headlines, all in one convenient video. Join Gary Thomson, the COO of FXOpen UK, as he breaks down the most significant news reports and shares his expert insights. Read the latest news

The Price of Silver Has Reached Its Highest Level in Over Three Years
As indicated by the XAG/USD chart today, the intraday price of silver reached $29.84 per ounce yesterday, while the previous yearly high on 12 April was $29.79. The last time this price was seen was in February

What Is the Wolfe Wave, and How Can You Trade It?
The Wolfe Waves is a powerful chart pattern recognised for analysing potential price reversals. Named after Bill Wolfe, who developed this formation through extensive trading practice, Wolfe Waves provide traders with a structured approach to anticipate market movements. In this