


FXOpen
LTC/USD
Since Monday when the price of Litecoin was $26.109 at the open, the cryptocurrency has experienced an increase of 23.33% measured to the current levels on which the coin is being traded at $32.2
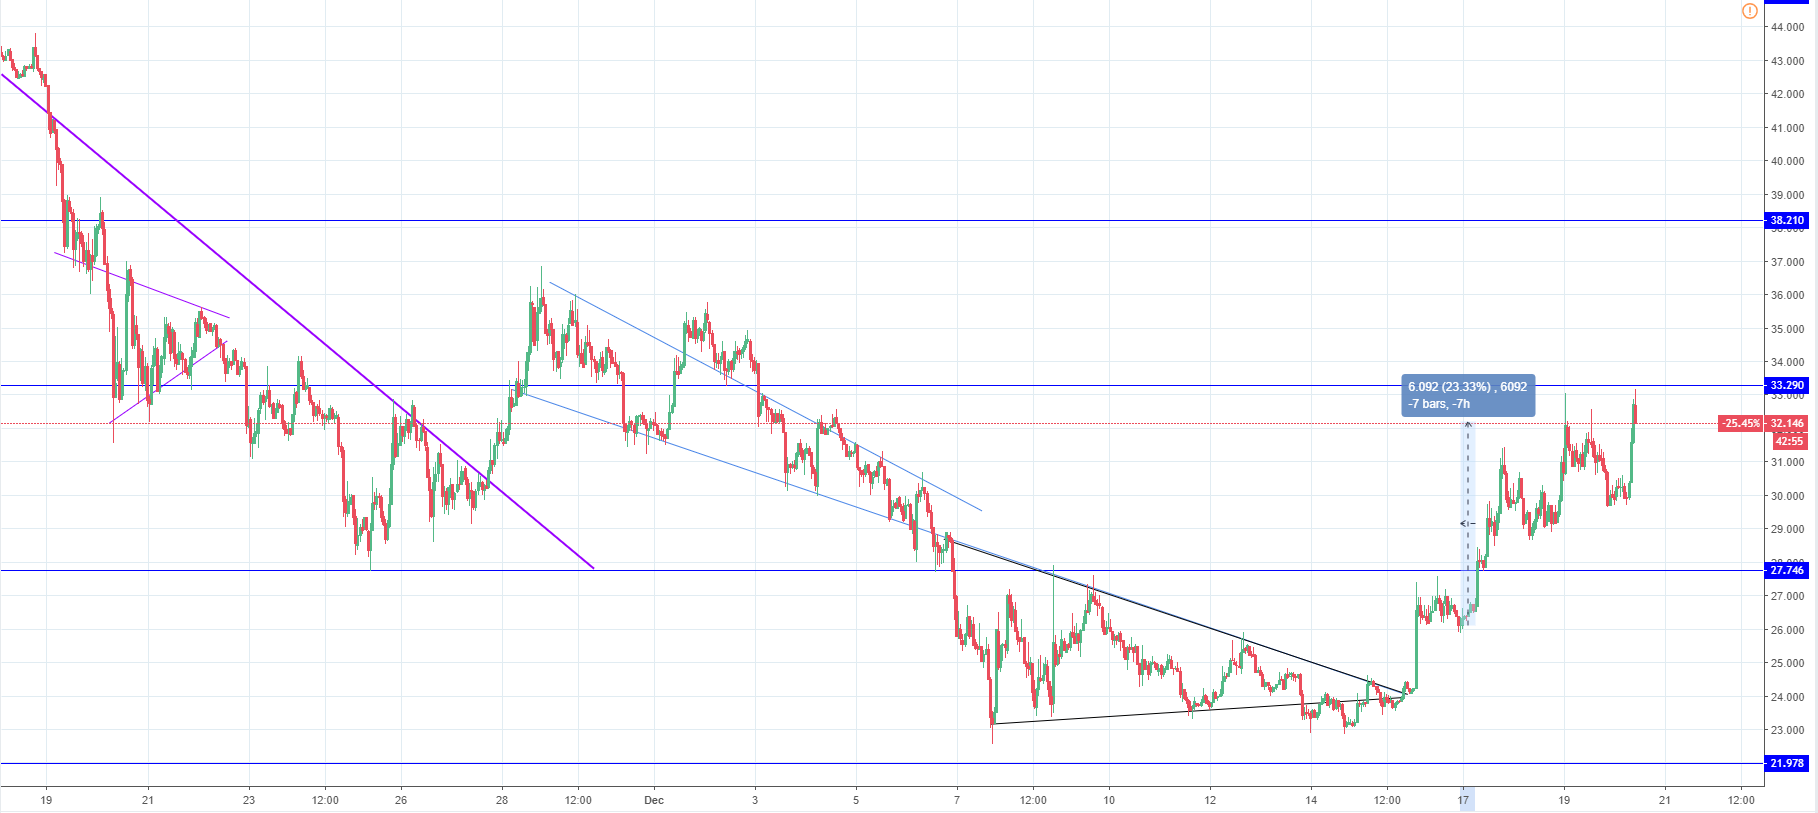
Looking at the hourly chart, you can see that the Monday’s open was the weekly low so far as the price previously increased from $23, which is the lowest prices has been the whole year to $26.975, where it interacted with the horizontal support level, which served as resistance at $27.74. On the next day, the price broke that horizontal resistance and went on to interact with the next horizontal resistance level at $33.29 and has interacted with it today for the second time.
The price did go slightly higher than the last time but the price is getting rejected as indicated by the current red candle and its wick from the upside. That is why from here I would expect the price to retrace back to establish some support.
The upward move is slowing down on its momentum as the upward moves are getting smaller and the pullbacks are getting deeper. So, if the price is to pullback again from these levels I would be expecting an interaction with the prior horizontal support level at $27.746.
We might see another minor increase before the pullback starts, which could lead the price slightly above the current resistance level but I wouldn’t expect it to go past $35 area.
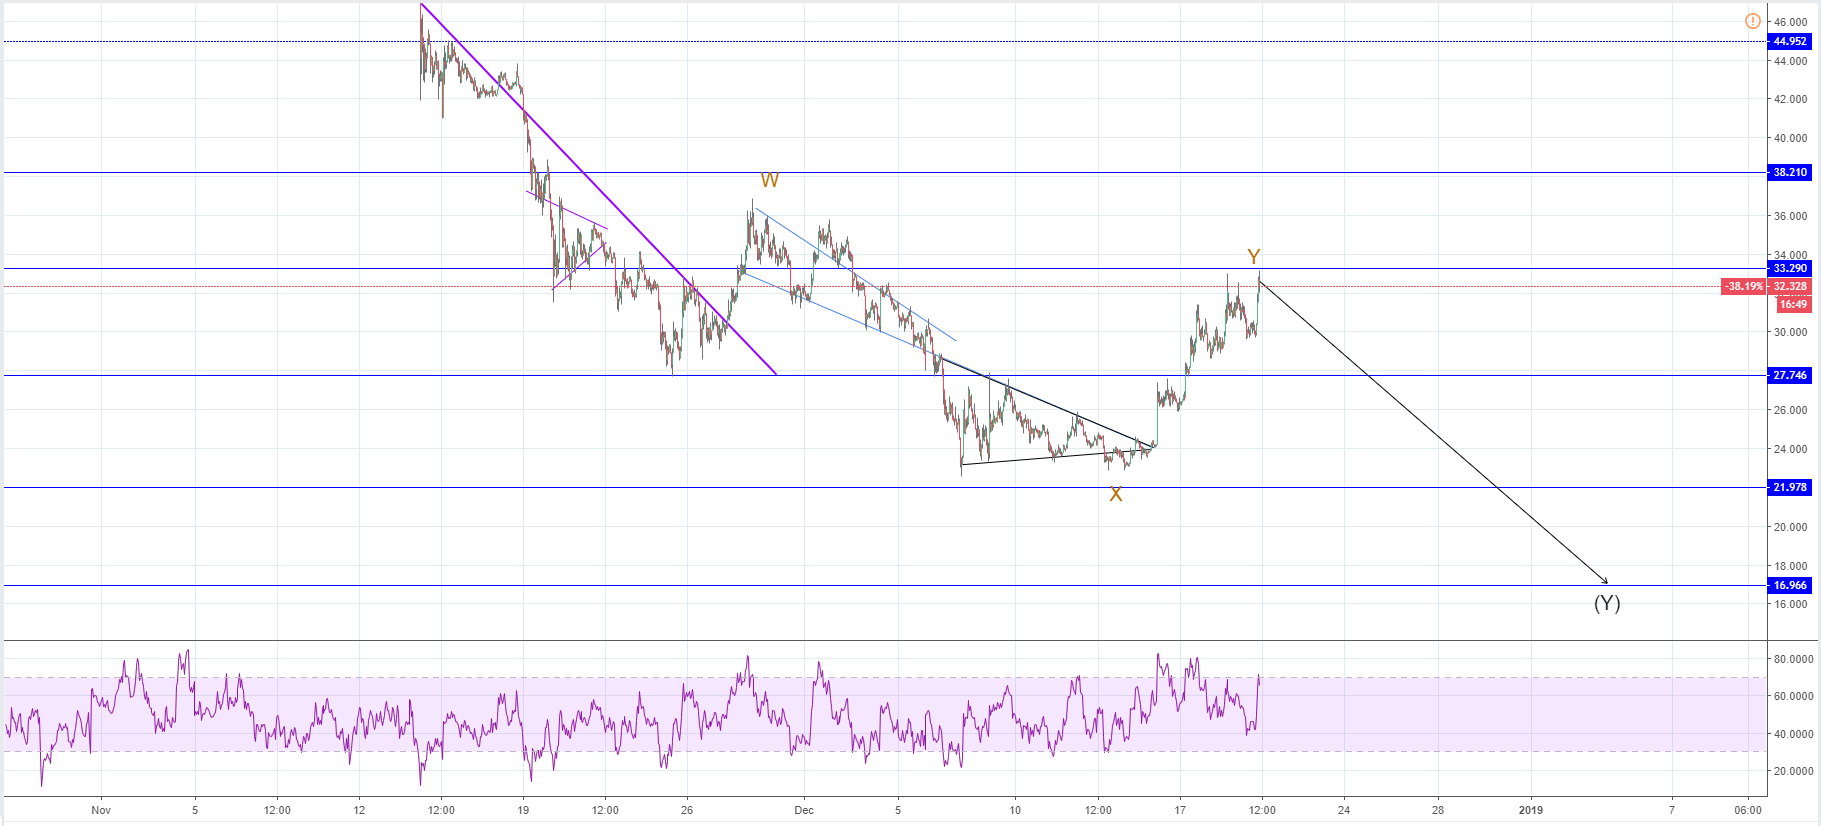
Zooming out further into the hourly chart and looking at the wave structure, I have labeled this whole move from 25th of November as a WXY correction after an impulsive down move. That is why after it ends I would be expecting that the price continues its downward trajectory.
RSI indicator has come to 70% level, which is its upper boarded that indicates overbought conditions and that isn’t the highest RSI has been recent as it came up to 82.3% on Sunday 16th of December when the price was around $27. You can also see that the RSI is in a downward trajectory even though the price is making new highs, which indicates that the momentum behind the increase is slowing down.
EOS/USD
From Monday’s open at $1.95 the price of EOS has increased by 43.08% measured to the current levels of $2.7973.
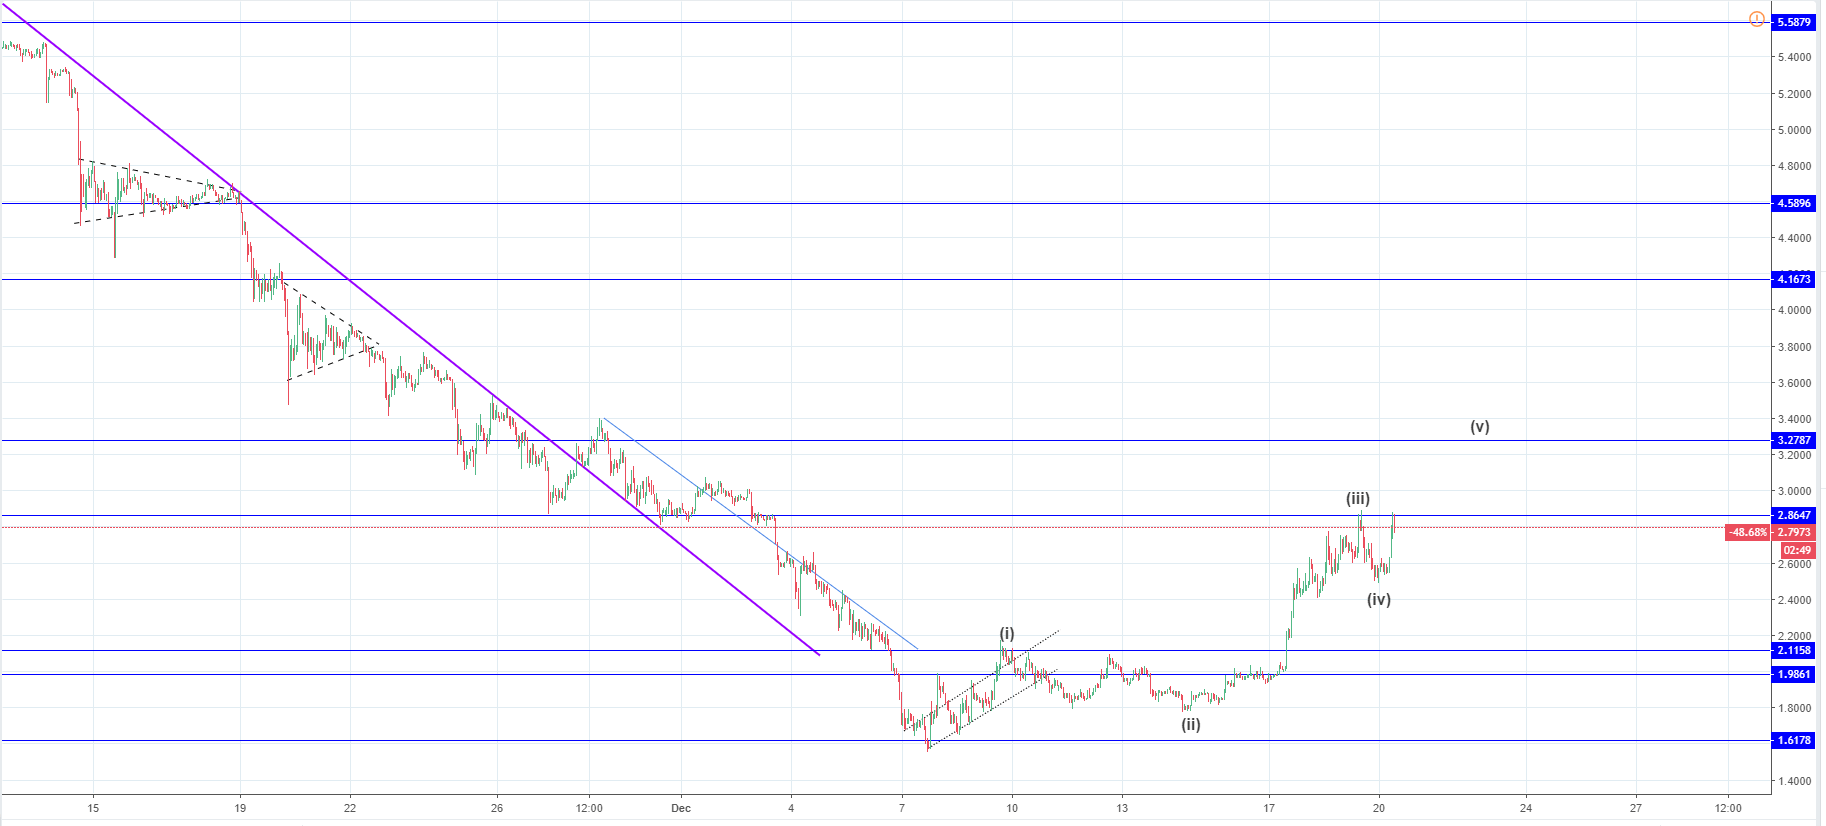
On the hourly chart, you can see that the price of EOS has started increasing from 7th of December when the price came down to $1.579 at its lowest point. Since then the price has started to recover and was at first stopped out at $2.11 horizontal resistance level after which the price pulled back and came down but this time, making a higher low at $1.8. As the higher low was established the buyers have started pushing the price higher again and succeeded to move to price beyond the previous resistance line. But then encountered some strong resistance at the next horizontal resistance level at $2.86 from which it pulled back.
Currently, the price is making another attempt to break the level and judging by the current candle it is failing to do so. The current increase that led the price back again to interact with the mentioned resistance level is the 5th wave from the upward move. The price could continue going up from here in which case I would expect it to go to the next horizontal resistance level at $3.27. The price could also very well start falling from here as the 5th wave could end on the vicinity of the 3rd wave’s ending point where the price is currently.
Zooming out further on to the hourly chart, you can see that the price has started this increase after breaking out from the previous downtrends resistance line that started after a Minor WXYXZ correction was finished. As the price is currently between the 0.236 and the 0.382 Fibonacci levels we are likely going to see some further increase potentially to the 0.382 Fibonacci level where the 5th wave ending point was projected previously before the price starts declining again.
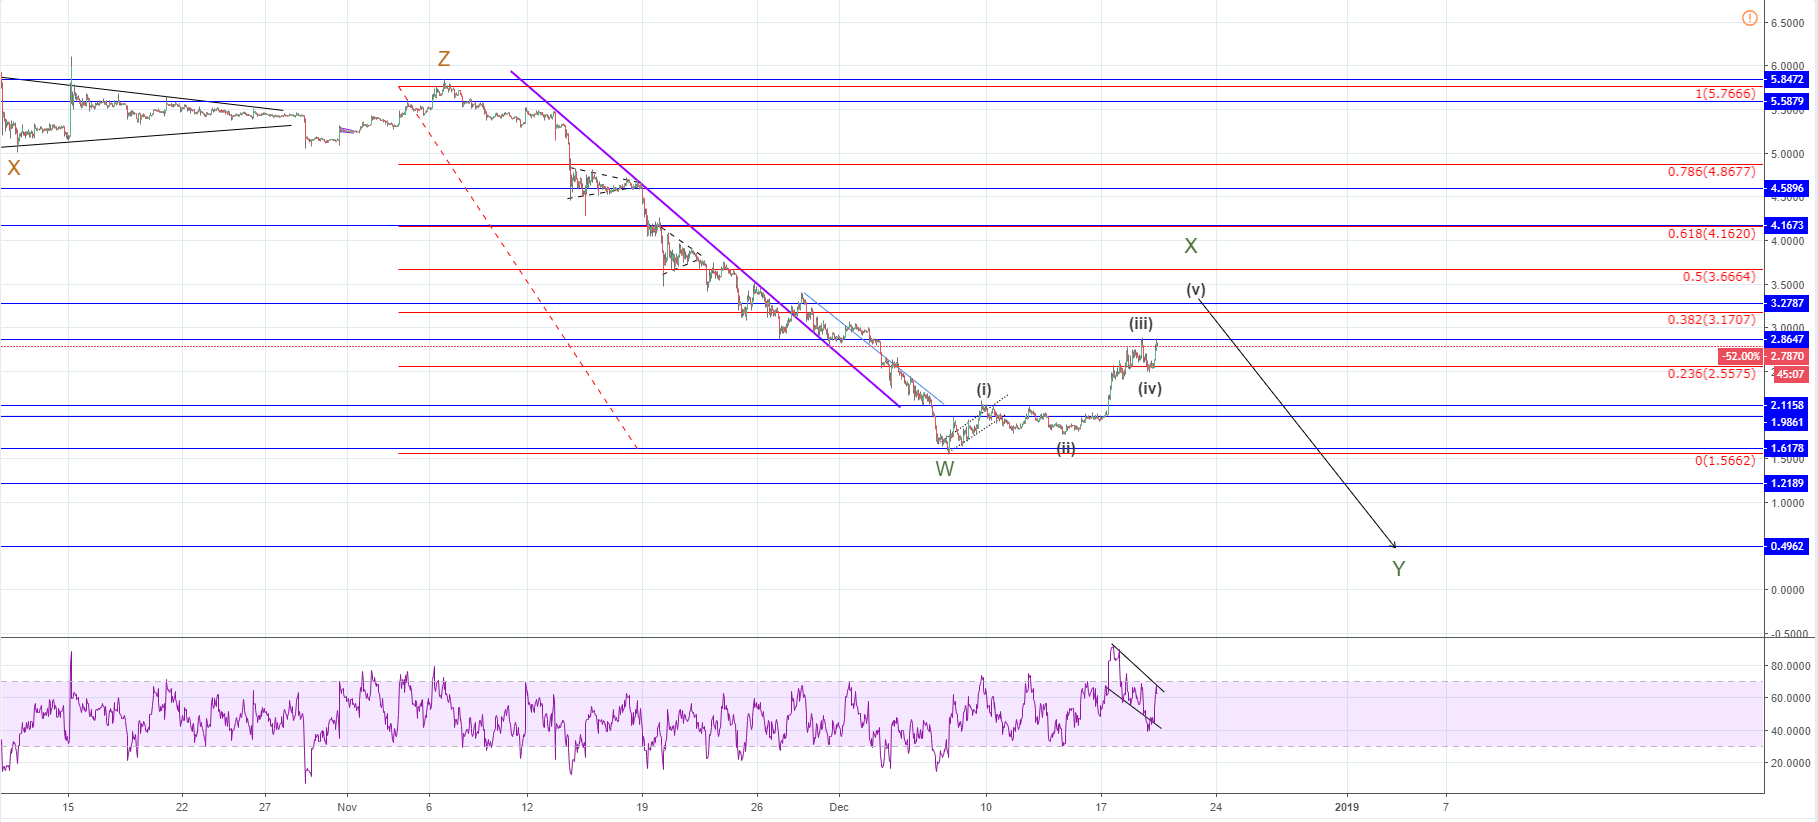
As the current structure looks like it is going to be another WXY correction to the downside the current increase would be the X wave, which could go up to 0.786 Fibonacci level before going down again and create new lows, but I don’t believe that will happen in a straight like even if it does.
RSI is indicating a bearish sentiment as the evaluation is forming a descending channel and is currently on the upper boarder at around 70%.
FXOpen offers the world's most popular cryptocurrency CFDs*, including Bitcoin and Ethereum. Floating spreads, 1:2 leverage — at your service. Open your trading account now or learn more about crypto CFD trading with FXOpen.
*At FXOpen UK and FXOpen AU, Cryptocurrency CFDs are only available for trading by those clients categorised as Professional clients under FCA Rules and Professional clients under ASIC Rules respectively. They are not available for trading by Retail clients.
This article represents the opinion of the Companies operating under the FXOpen brand only. It is not to be construed as an offer, solicitation, or recommendation with respect to products and services provided by the Companies operating under the FXOpen brand, nor is it to be considered financial advice.
Latest articles

Anchored VWAP and How You Can Use It in Forex Trading
In the world of forex trading, understanding the nuanced tools at your disposal can significantly enhance decision-making processes. One such sophisticated tool is the Anchored Volume-Weighted Average Price (Anchored VWAP), which refines the standard VWAP by allowing traders to set

META Share Price Collapses after Publication of Quarterly Report
Just yesterday, META's stock price closed at USD 493.50, up approximately 40% since the start of 2024 and up nearly 300% since the start of 2023.
However, following the release of Meta's quarterly report, its shares plummeted to USD

USD/JPY Analysis: The Rate Exceeds The Level of 155 Yen Per US Dollar
Today, the price of USD/JPY once again renewed its 34-year high, exceeding the level of 155 yen per dollar, which put pressure on the current authorities.
According to Reuters, officials are trying to maintain calm in the market.
"We