


FXOpen

LTC/USD
From last Wednesday when the price of Litecoin reached $59.991 at its highest point measured to today’s low at $51.864 we have seen a decrease of 13.55%. As you can see from the hourly chart below the price came up last week to the ascending channels resistance level and got rejected like expected which is why we have seen the move to the downside below it’s support level.
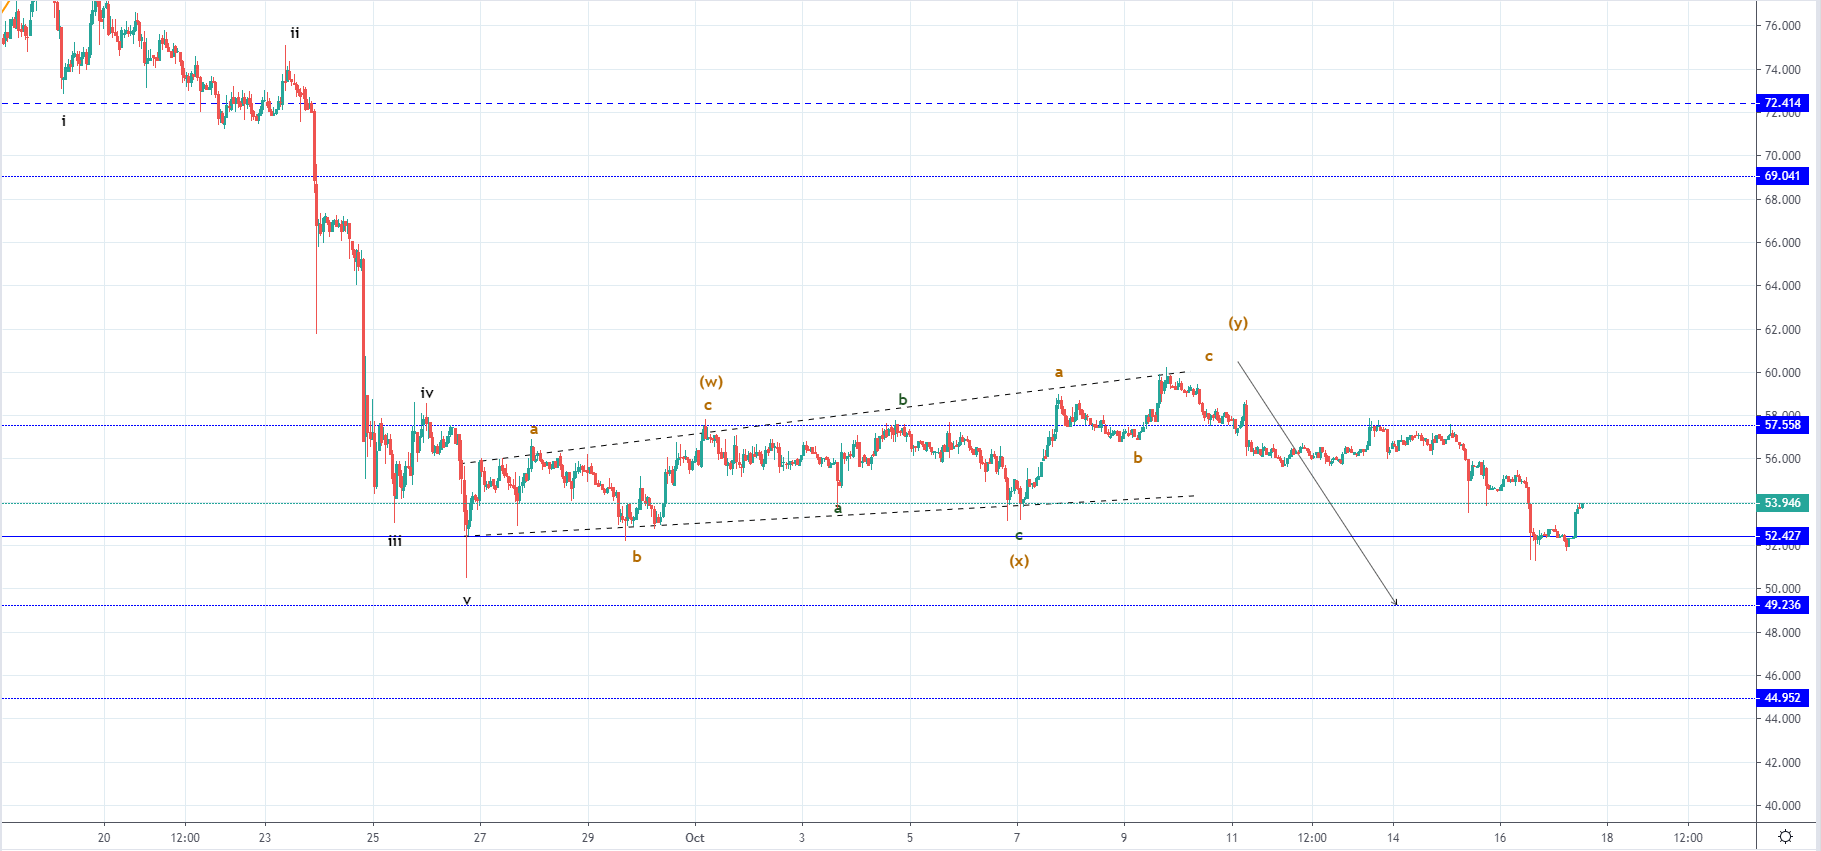 Prior to the completion of the WXY correction, we have seen a five-wave decrease to the downside which is why this corrective structure started developing. As it ended without prolongation the next move to the downside we are currently seeing could be the start of another five-wave move which is set to push the price to some of the horizontal support levels below $50, but at the moment we are seeing that the price found support on the $52.427 level which now serves as a pivot point.
Interaction with the horizontal support level today has caused a bounce with the price getting into an upward trajectory again and is showing signs of bullishness but is currently retesting the X wave low vicinity for resistance which could also serve as an indication of the future price action pathway. If the price continues moving above the current level, retest the $52.4 level and finds support there yet again it could mean that we have seen the completion of the descending move. But more likely the downfall is yet to develop fully in which case I would be expecting the price below $50.
EOS/USD
The price of EOS has been in a downtrend from last Wednesday like Litecoin and has decreased by 13.81% coming from Wednesday’s high at $3.319 to $2.86 at its lowest point today.
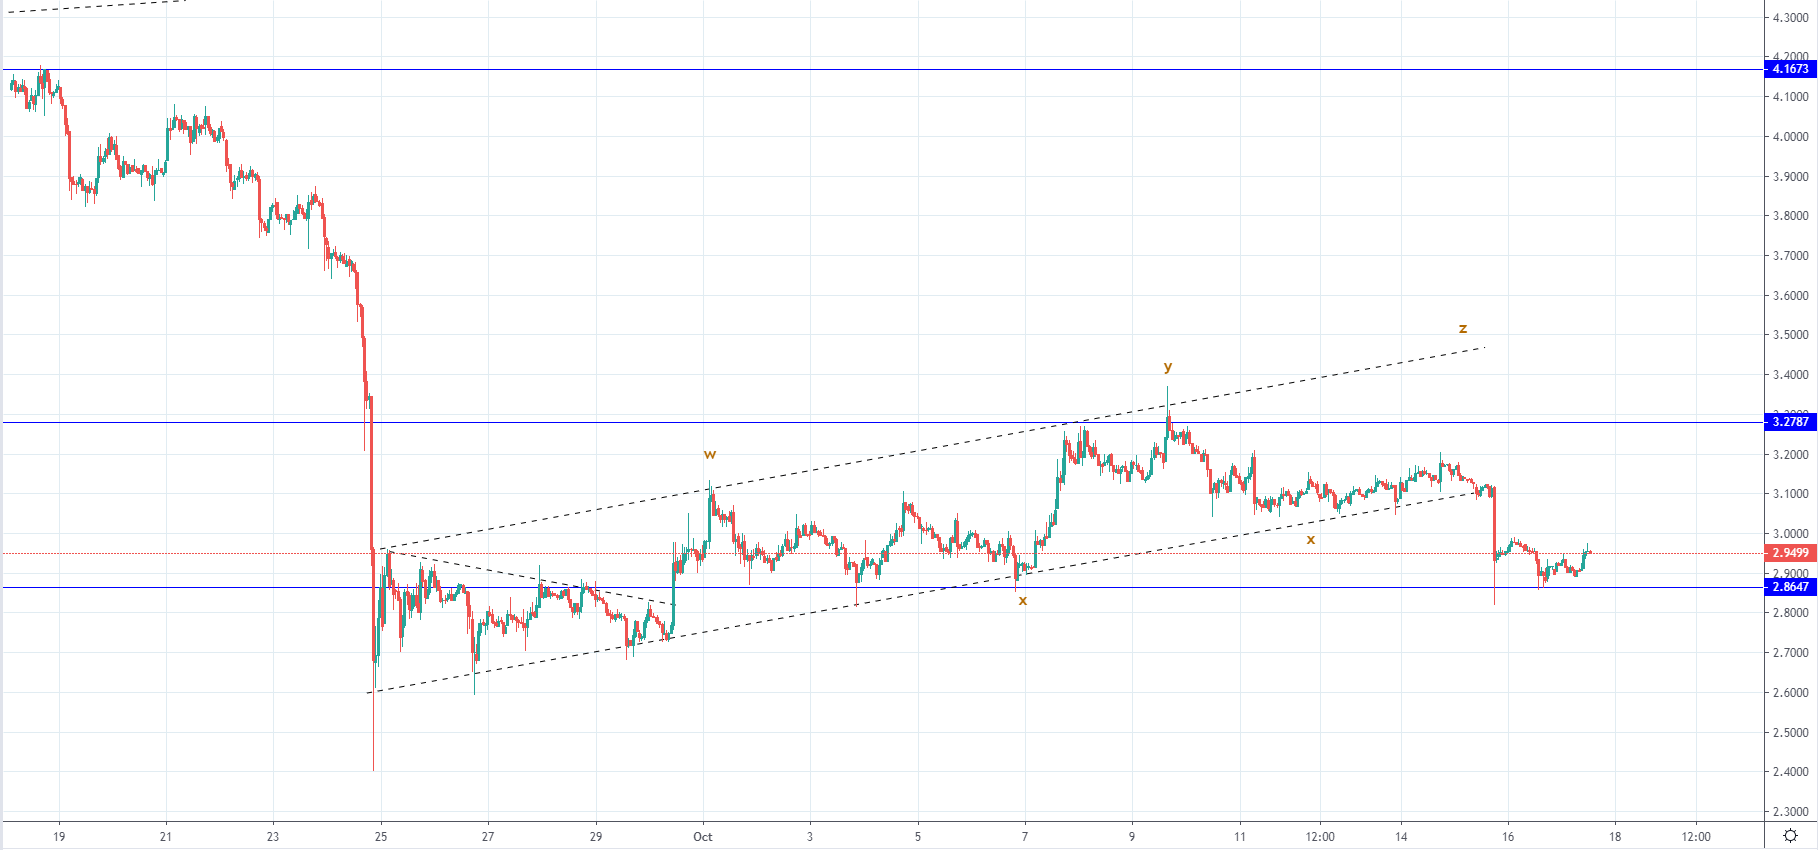 Looking at the hourly chart, you can see that the price of EOS also ended its WXY correction with no prolongation before starting to move to the downside again and breaking out from the ascending channels support level. The price found support on the next significant level which is the horizontal support at $2.86 as today’s interaction ended as a bounce. Currently, we are seeing the price struggling to make a higher high and is showing signs of weakness, indicated by the wick from the upper side of the previous hourly candle, signaling seller’s pressure is present at those levels so the bounce might not lead to a more sustainable one.
Similarly like in the case of Litecoin I would be expecting downtrend continuation from here below the horizontal support level and potentially as a retest of the $2.6 low which if doesn’t serve as another support point will result in a further downfall to $2.11 which is the next significant horizontal level in line.
FXOpen offers the world's most popular cryptocurrency CFDs*, including Bitcoin and Ethereum. Floating spreads, 1:2 leverage — at your service. Open your trading account now or learn more about crypto CFD trading with FXOpen.
*At FXOpen UK and FXOpen AU, Cryptocurrency CFDs are only available for trading by those clients categorised as Professional clients under FCA Rules and Professional clients under ASIC Rules respectively. They are not available for trading by Retail clients.
This article represents the opinion of the Companies operating under the FXOpen brand only. It is not to be construed as an offer, solicitation, or recommendation with respect to products and services provided by the Companies operating under the FXOpen brand, nor is it to be considered financial advice.
Latest from Cryptocurrencies
Latest articles

Weekly Market Wrap With Gary Thomson: UK100, USD, GOLD, OIL
Get the latest scoop on the week's hottest headlines, all in one convenient video. Join Gary Thomson, the COO of FXOpen UK, as he breaks down the most significant news reports and shares his expert insights.
- UK100 Share Index Rises

What Is a Darvas Box Theory and How Does It Work in Trading?
The Darvas Box Theory, pioneered by Nicolas Darvas in the 1950s, has transcended its stock market origins to become a valuable tool for forex traders. This method leverages specific price movements and patterns, known as the Darvas Box, to track

NFLX Stock Price Falls Despite Subscriber Growth
Yesterday, after the close of the main trading session on the stock market, Netflix reported to investors for the 1st quarter of 2024.
The report turned out better than expected:
→ earnings per share: actual = USD 5.28, forecast = USD 4.