


FXOpen

LTC/USD
From last week’s low at $41.72 made on Friday the price of Litecoin has increased by 11.71% measured to the highest point on Monday which was at $46.61. Since then we have seen a decrease of 7.78% as the price fell to $43 area yesterday but made a minor recovery and is currently being traded around $43.6.
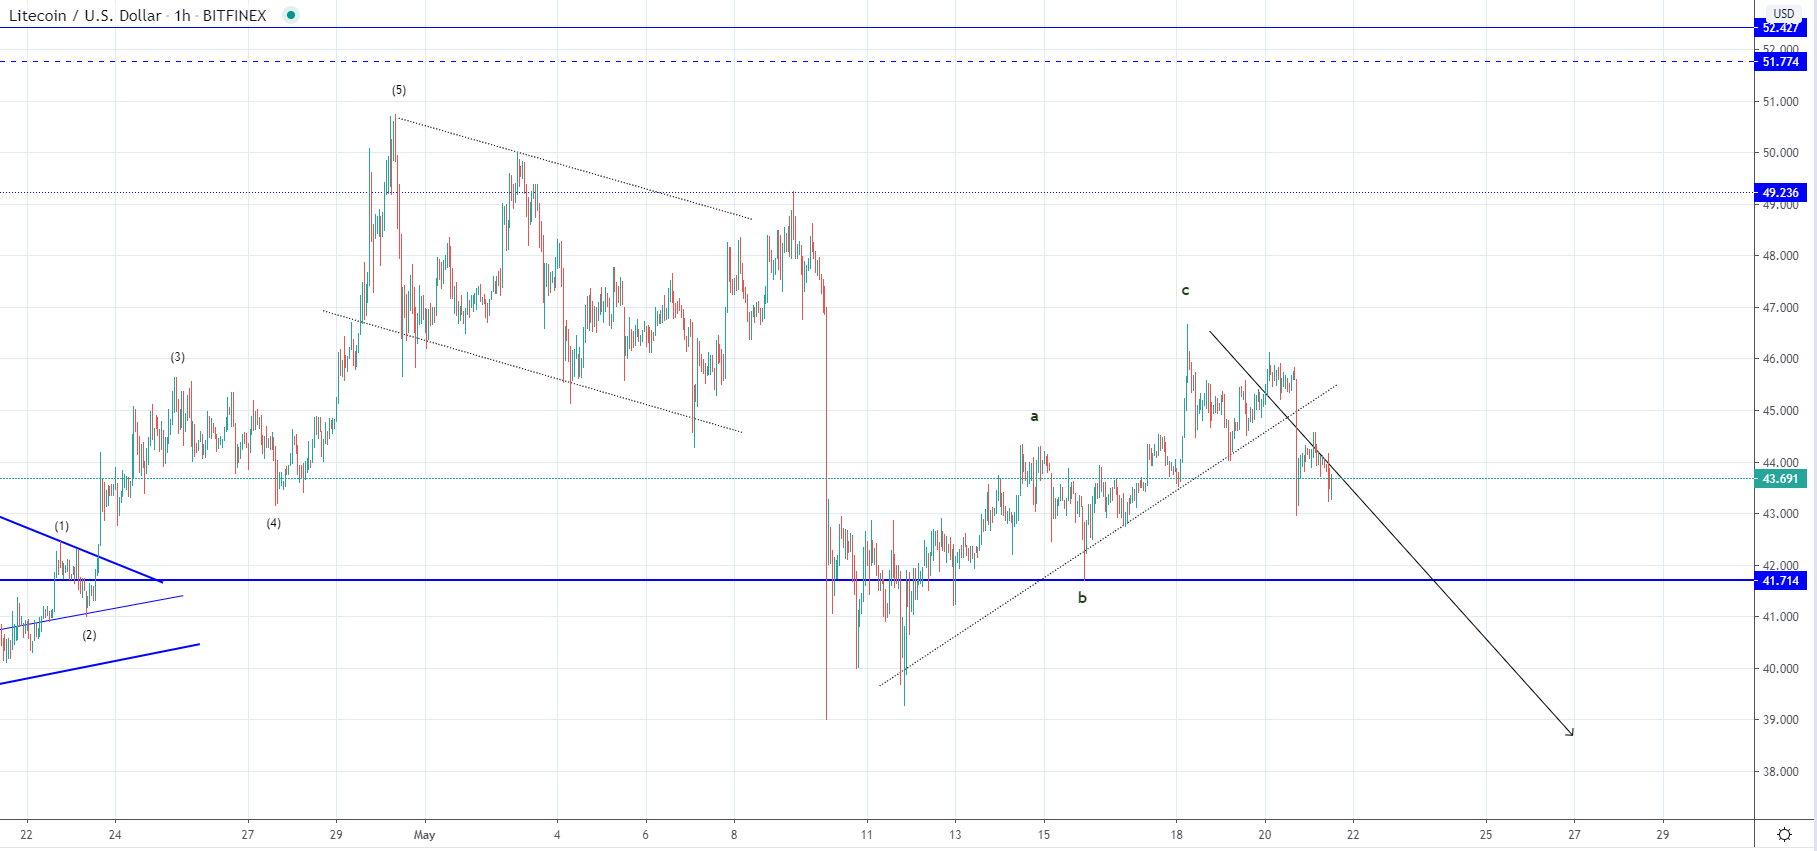 On the hourly chart, you can see that the price broke down the ascending trendline which formed since the 11th of May when the price was sitting at its lowest after a steep downfall. This trendline indicated that the recovery seen is out of the same degree and was most likely an ABC to the upside. The breakout could be an early indication that the correctional upside movement has ended with the price now starting another move to the downside.
C wave has a clear five-wave structure but the 3rd wave is the shortest which it cannot be. Another move to the upside could have looked likely because of this but as the price moved inside the territory of the 1st sub-wave from the C wave at $43.9 this possibility is invalidated. If the price continues moving to the downside and goes below yesterday’s low it could mean that the first five-wave move has developed to the downside in which case I would be expecting a correction to the half range at around $44.7 before the next downturn develops.
EOS/USD
From Monday’s high at $2.75 the price of EOS has decreased by little below 8% as it came down to $2.53 yesterday. After a slight recovery to $2.6 it’s currently being traded lower at around $2.56 and is in a downward trajectory.
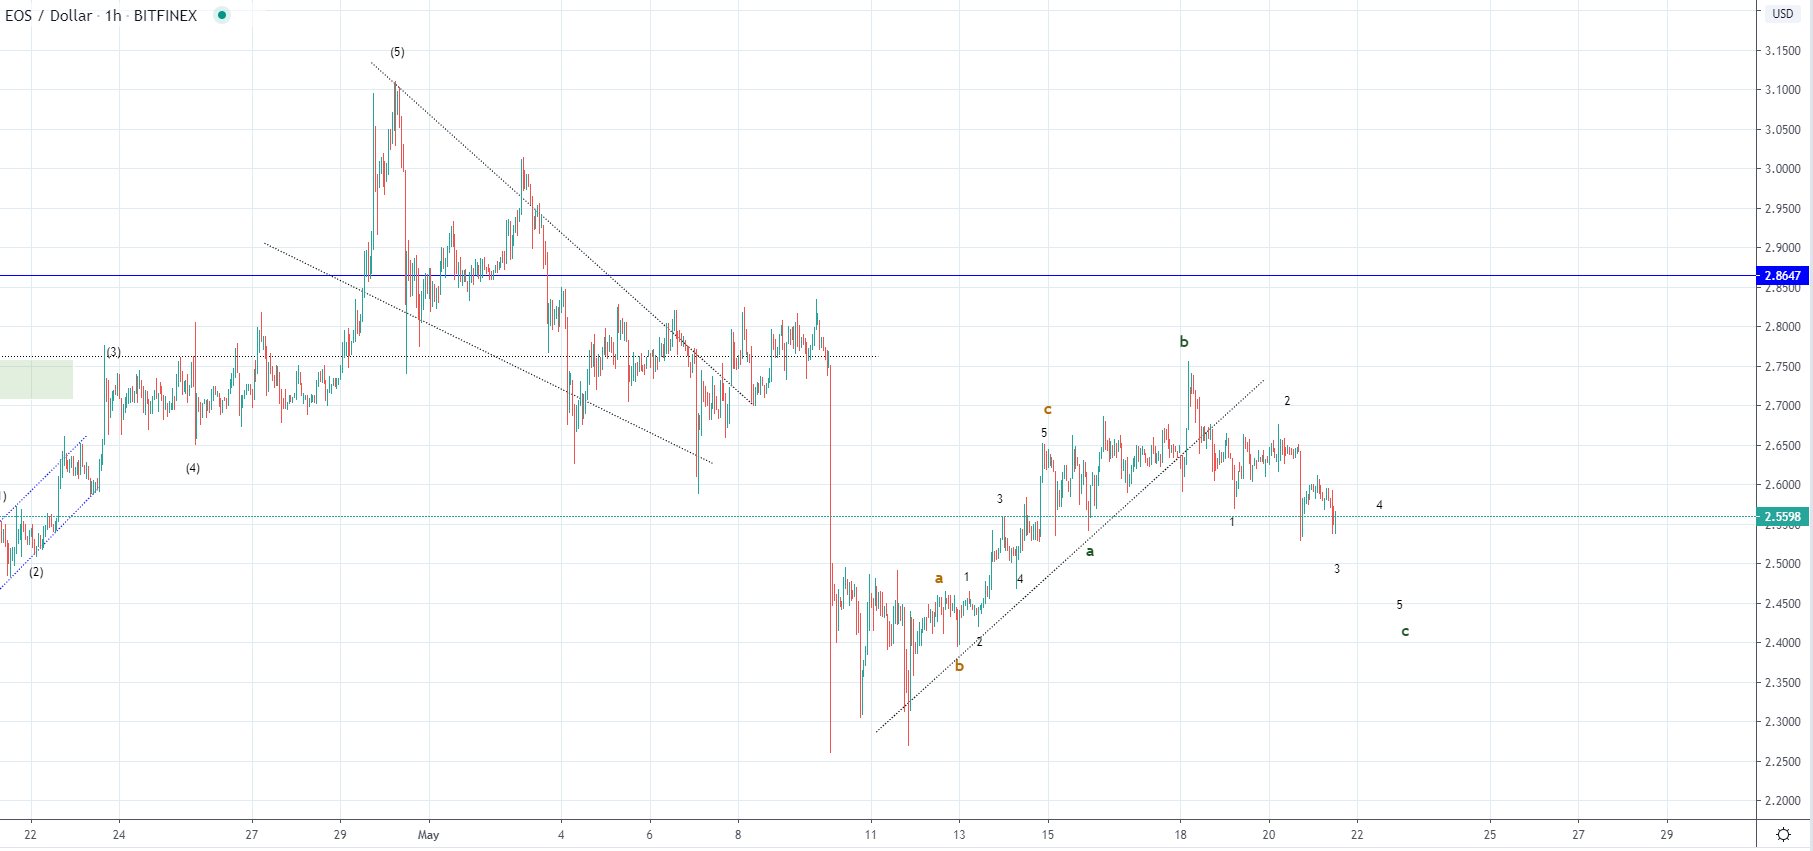
Looking at the hourly chart, we can see a similar pattern to that of LTC but a different interpretation can be made. A wave in the Litecoin’s chart is the ABC in this one with the next move that came after to the upside being the B wave out of the descend ABC to the downside which is now developing its C wave. If this is true then the price is likely to continue moving further to the downside after this minor lower low is being made and is likely to end around the vicinity of the A wave’s ending point at $2.45
But if this is true, then uptrend continuation could occur after the completion of the descending ABC as a further correctional movement to the upside could be anticipated.
FXOpen offers the world's most popular cryptocurrency CFDs*, including Bitcoin and Ethereum. Floating spreads, 1:2 leverage — at your service. Open your trading account now or learn more about crypto CFD trading with FXOpen.
*At FXOpen UK and FXOpen AU, Cryptocurrency CFDs are only available for trading by those clients categorised as Professional clients under FCA Rules and Professional clients under ASIC Rules respectively. They are not available for trading by Retail clients.
This article represents the opinion of the Companies operating under the FXOpen brand only. It is not to be construed as an offer, solicitation, or recommendation with respect to products and services provided by the Companies operating under the FXOpen brand, nor is it to be considered financial advice.
Latest from Cryptocurrencies
Latest articles

Weekly Market Wrap With Gary Thomson: UK100, USD, GOLD, OIL
Get the latest scoop on the week's hottest headlines, all in one convenient video. Join Gary Thomson, the COO of FXOpen UK, as he breaks down the most significant news reports and shares his expert insights.
- UK100 Share Index Rises

What Is a Darvas Box Theory and How Does It Work in Trading?
The Darvas Box Theory, pioneered by Nicolas Darvas in the 1950s, has transcended its stock market origins to become a valuable tool for forex traders. This method leverages specific price movements and patterns, known as the Darvas Box, to track

NFLX Stock Price Falls Despite Subscriber Growth
Yesterday, after the close of the main trading session on the stock market, Netflix reported to investors for the 1st quarter of 2024.
The report turned out better than expected:
→ earnings per share: actual = USD 5.28, forecast = USD 4.