


FXOpen

LTC/USD
From Tuesday’s low at $192.55, the price of Litecoin has been on the rise again and came up to $208 at its highest point today, which was an increase of 8.4%. Currently, it is being traded at $204.34 as the minor pullback is being made but the price is still in an upward trajectory overall.
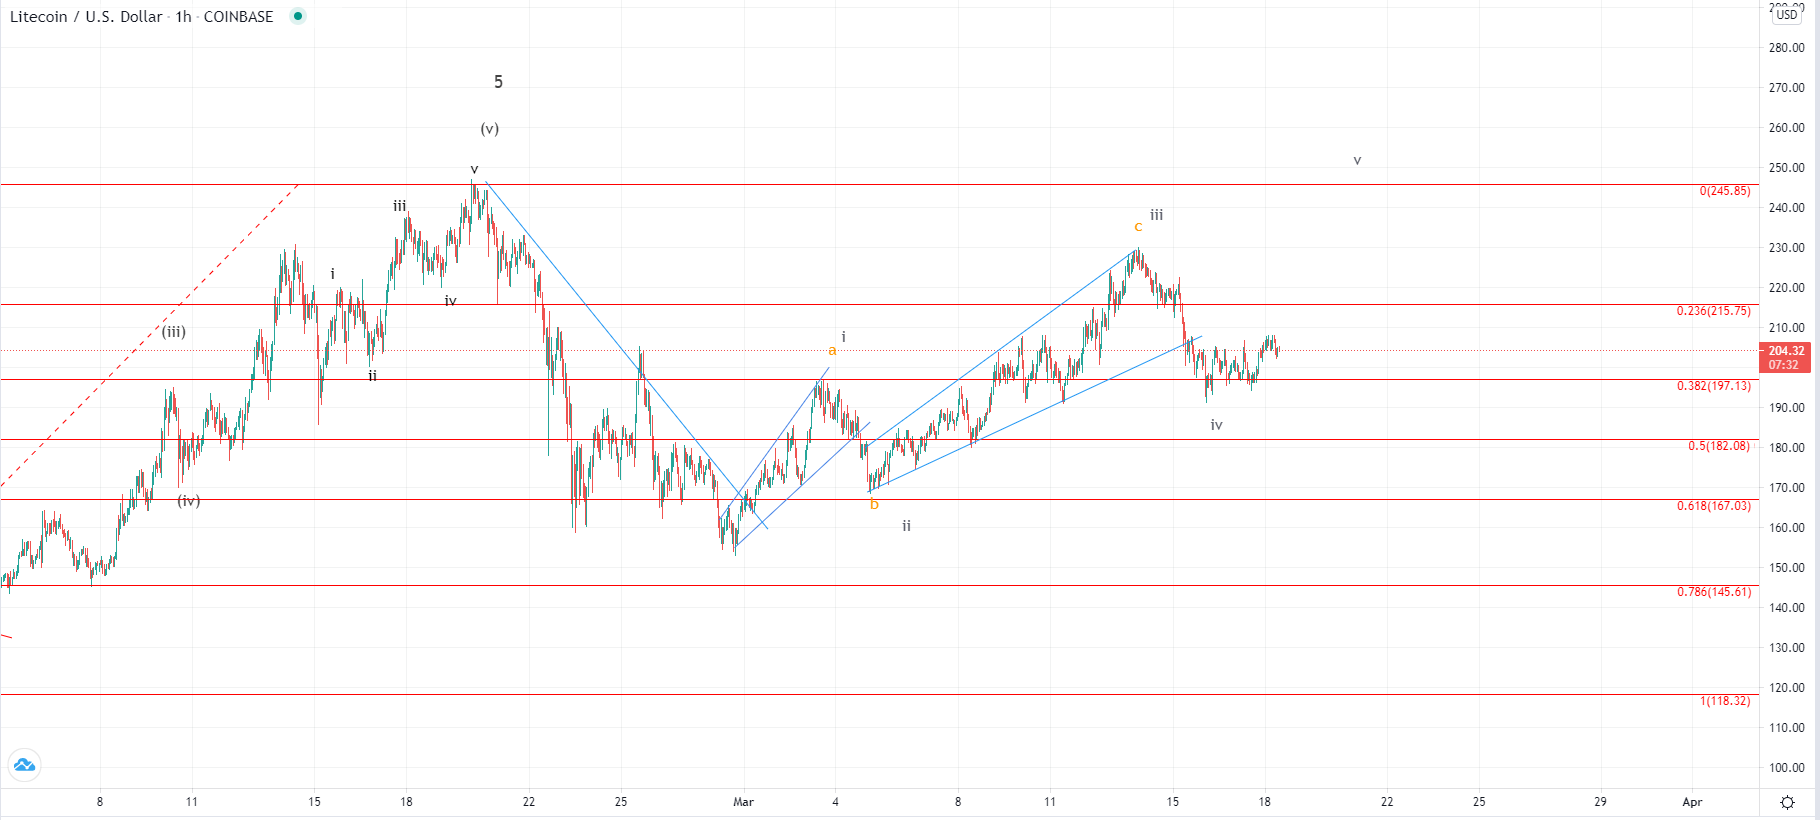
On the hourly chart, you can see that the price fell back to 0.382 Fibonacci level on Tuesday where it found support and bounce back to the upside. However, the recovery we have seen isn’t that significant which is why there is still a possibility that it is corrective in nature and is the part of the higher degree downfall that is set to push the price of Litecoin below the $200 area again.
All said is applicable on the higher time frame and could be viewed as a fractal, as from the start of the month we have seen a recovery that could be corrective and would lead to a lower low compared to the one made on the 28th of February. This is why now we could either be seeing the start of the 5t wave in a bullish scenario or the second sub-wave of the higher degree five-wave move to the downside.
The pivot point is the 0.382 Fibonacci level whose breakout to the downside would invalidate the bullish count, but today’s bounce from it indicates that it is still the main expected outlook.
EOS/USD
From Tuesday’s low at $3.66 the price of EOS has risen by 14.32% today as it came up to $4.18 at its highest point. We have seen a minor pullback with the price going inside the territory of the lower range below the prior high but is currently being traded at $4.1
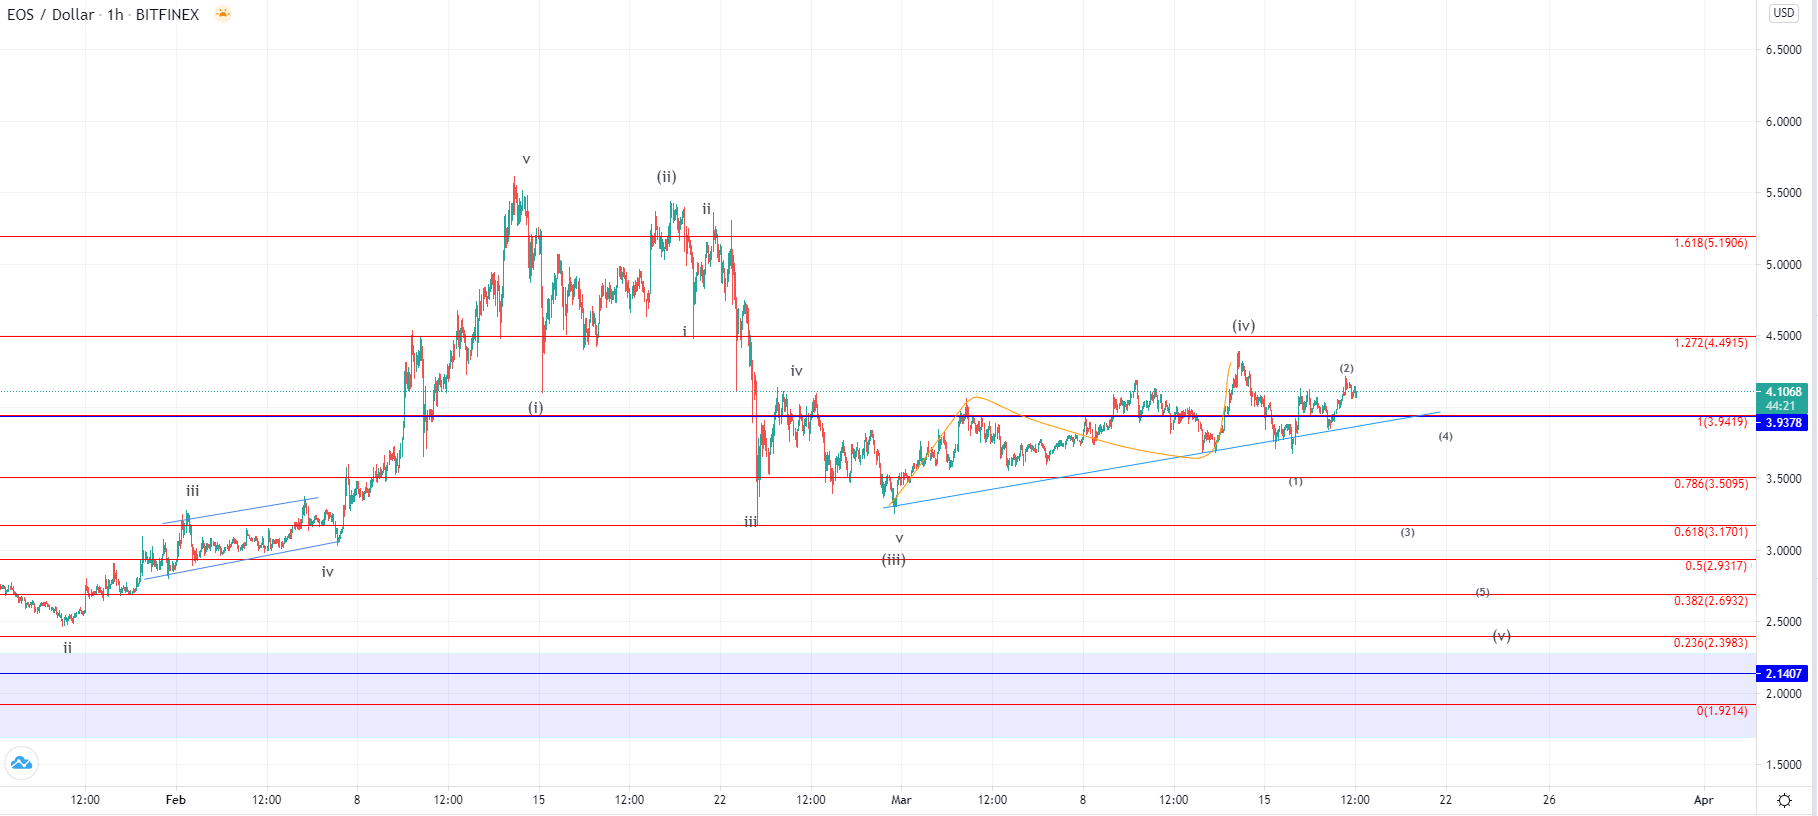
Looking at the hourly chart, you can see that this is a recovery from the descending move that started on the 14th of March when it spiked to $4.396 which is why the upward movement could be corrective in nature much like that is the case on the Litecoin chart. From the start of the month, we have seen an ascending channel forming but the price hasn’t been able to start moving impulsively to the upside and has instead made a choppy price action.
This could have been the 4th wave out of the higher degree five-wave impulse to the downside which is why now there is a possibility that the price is headed for a breakout to the downside below the ascending support level. If we see the price moving down to the 1 Fib level and makes another interaction with the support level a breakout would look more likely, but if it continues moving to the upside and goes above the prior high at $4.4 area then there could be a possibility that we have seen the start of the next impusle to the upside from the start of March.
This forecast represents FXOpen Markets Limited opinion only, it should not be construed as an offer, invitation or recommendation in respect to FXOpen Markets Limited products and services or as financial advice.
Cryptocurrency CFDs are not available to trade in all jurisdictions.
FXOpen offers the world's most popular cryptocurrency CFDs*, including Bitcoin and Ethereum. Floating spreads, 1:2 leverage — at your service. Open your trading account now or learn more about crypto CFD trading with FXOpen.
*At FXOpen UK and FXOpen AU, Cryptocurrency CFDs are only available for trading by those clients categorised as Professional clients under FCA Rules and Professional clients under ASIC Rules respectively. They are not available for trading by Retail clients.
This article represents the opinion of the Companies operating under the FXOpen brand only. It is not to be construed as an offer, solicitation, or recommendation with respect to products and services provided by the Companies operating under the FXOpen brand, nor is it to be considered financial advice.
Latest from Cryptocurrencies
Latest articles

Weekly Market Wrap With Gary Thomson: UK100, USD, GOLD, OIL
Get the latest scoop on the week's hottest headlines, all in one convenient video. Join Gary Thomson, the COO of FXOpen UK, as he breaks down the most significant news reports and shares his expert insights.
- UK100 Share Index Rises

What Is a Darvas Box Theory and How Does It Work in Trading?
The Darvas Box Theory, pioneered by Nicolas Darvas in the 1950s, has transcended its stock market origins to become a valuable tool for forex traders. This method leverages specific price movements and patterns, known as the Darvas Box, to track

NFLX Stock Price Falls Despite Subscriber Growth
Yesterday, after the close of the main trading session on the stock market, Netflix reported to investors for the 1st quarter of 2024.
The report turned out better than expected:
→ earnings per share: actual = USD 5.28, forecast = USD 4.