


FXOpen

LTC/USD
From Sunday, when the price of Litecoin was sitting at its highest point at $64.84 measured to the lowest point the price has been today which is at $58.572 we have seen a decrease of 9.67%. The price is in a downward trajectory as a breakout has been made from the ascending triangle made from the 26th of October.
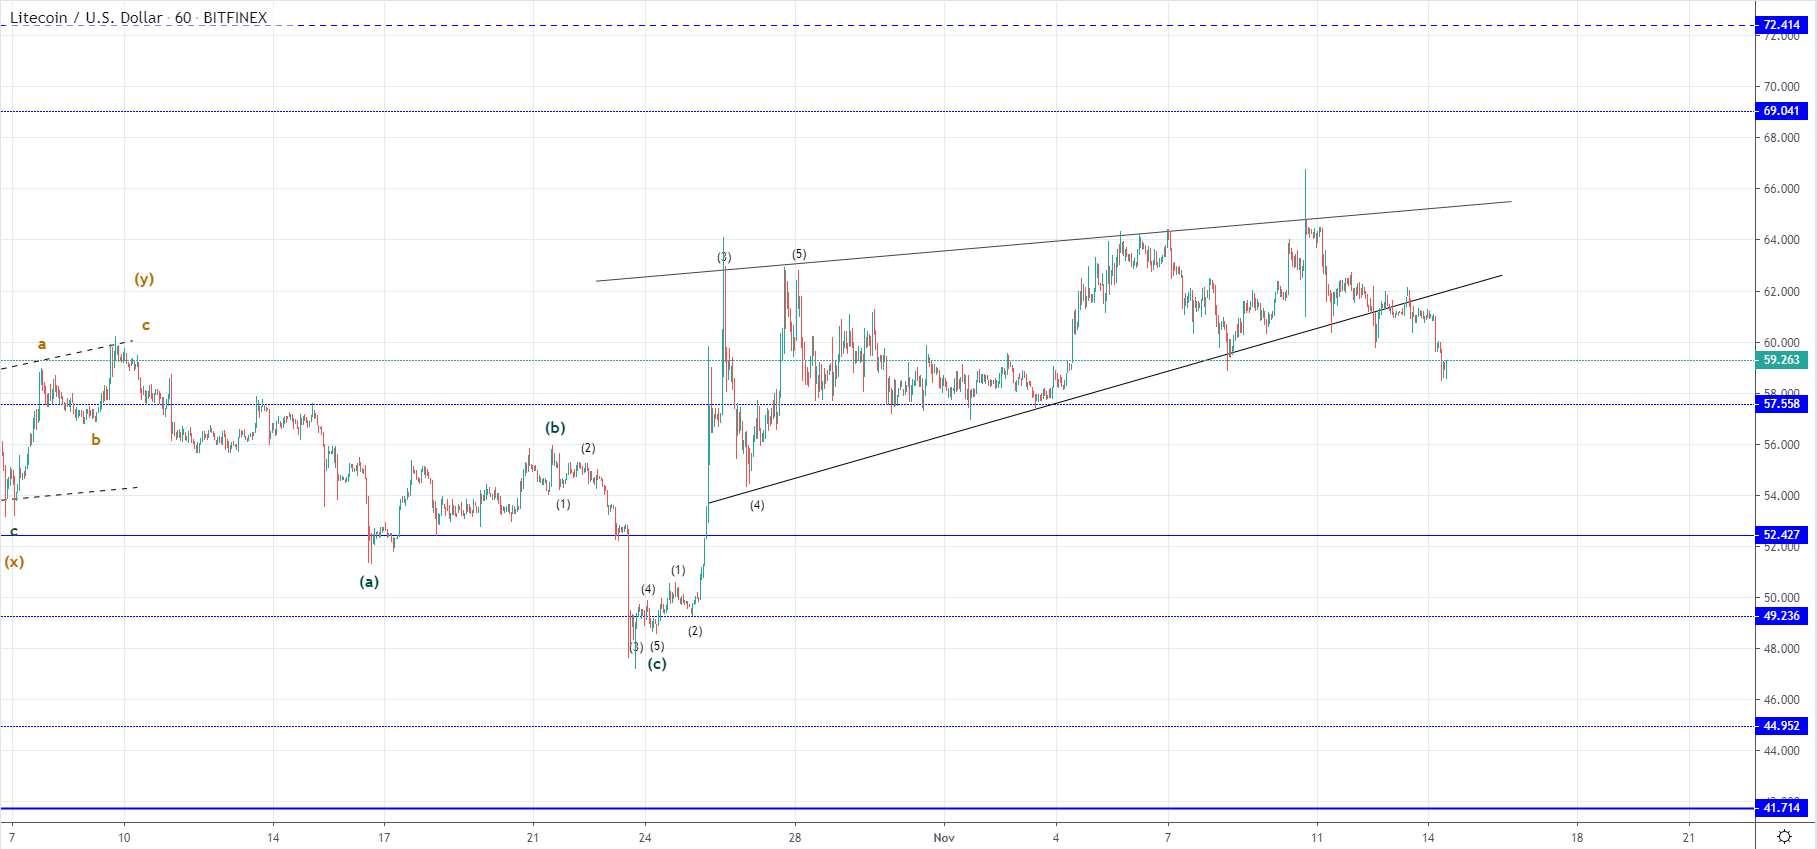 On the hourly chart, you can see that the price of Litecoin has increased impulsively after an interaction with the $49.23 level in a five-wave manner. The triangle which was formed after could be considered corrective and is most likely the 2nd wave out of the starting upside move but it still unclear whether it would be another corrective one or an impulsive one.
Considering the rise we have seen from the 26th of October and the length of the corrective triangle I believe that the second one is more likely, but as a breakout from the triangle was made on the downside a sign of confirmation is needed. This could come in the form of price holding above the $57.558 significant level or above the lower one at around $52.4, but if the price continues moving below the second horizontal level in line it could indicate further lows for Litecoin.
EOS/USD
Similarly, as in the case of Litecoin, the price of EOS has also formed an ascending triangle after an impulsive increase and after reaching $3.61 on Sunday it started declining. The price decreased by 7.44% from there to the lowest point today at $3.34 around which the price is currently being traded and consequently made a breakout to the downside from the triangle.
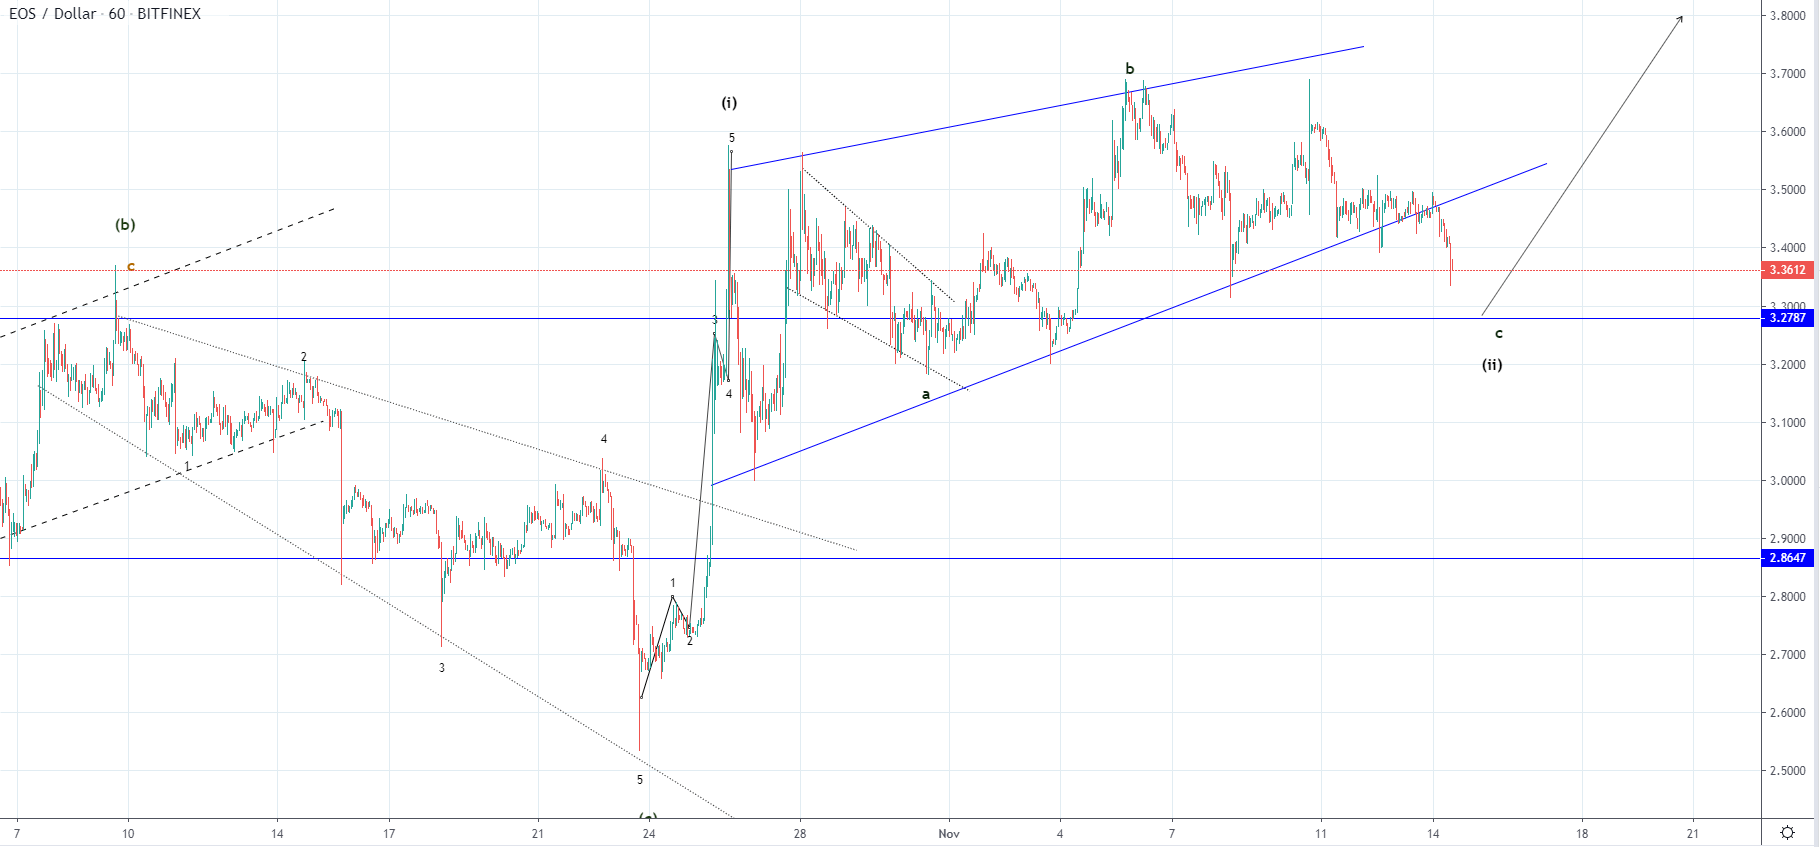 As the triangle’s wave structure looks corrective, its continuation would be expected but not below the $3.27 horizontal level. Inside the triangle, we have seen two corrective structures developing which is why the current one is considered the final one after which the uptrend should continue, but if the price continues moving below the $3.2 level we could see further depreciation before the expected uptrend continuation starts.
The lower horizontal support level on which the corrective depreciation could end is the resistance from the consolidative horizontal range at $3, but the one at $2.8 which served as support in the mentioned range is a more significant one and its retest before the uptrend continuation would look reasonable in the price progression.
In either way, after the downfall ends I will be expecting another increase from which we are to see if this is the start of the higher degree uptrend or not.
FXOpen offers the world's most popular cryptocurrency CFDs*, including Bitcoin and Ethereum. Floating spreads, 1:2 leverage — at your service. Open your trading account now or learn more about crypto CFD trading with FXOpen.
*At FXOpen UK and FXOpen AU, Cryptocurrency CFDs are only available for trading by those clients categorised as Professional clients under FCA Rules and Professional clients under ASIC Rules respectively. They are not available for trading by Retail clients.
This article represents the opinion of the Companies operating under the FXOpen brand only. It is not to be construed as an offer, solicitation, or recommendation with respect to products and services provided by the Companies operating under the FXOpen brand, nor is it to be considered financial advice.
Latest articles

Weekly Market Wrap With Gary Thomson: UK100, Hang Seng Index, AUD/JPY, GBP/USD, USD/CAD
Get the latest scoop on the week's hottest headlines, all in one convenient video. Join Gary Thomson, the COO of FXOpen UK, as he breaks down the most significant news reports and shares his expert insights.
- UK100 Analysis: Stock Market

What Is the ICT Silver Bullet Strategy, and How Does It Work?
The ICT Silver Bullet strategy offers traders a unique approach to capitalising on market opportunities during specific trading hours. This article explored this advanced strategy, explaining the role of fair value gaps, liquidity, and timeframes and how to implement it.

Analytical Euro to Dollar Predictions for 2024-2025
The EUR/USD currency pair stands as a critical barometer of economic interactions and the relative strength between the Eurozone and the United States. This article delves into the recent history, economic outlooks, and analytical euro-to-dollar forecasts for this major