


FXOpen

LTC/USD
The price of Litecoin has increased by almost 7% today, coming from yesterday’s low at $37.55 to $40.168 on today’s high. It is being traded at $39.44 at the moment with the momentum slowing down and is in the downward trajectory.
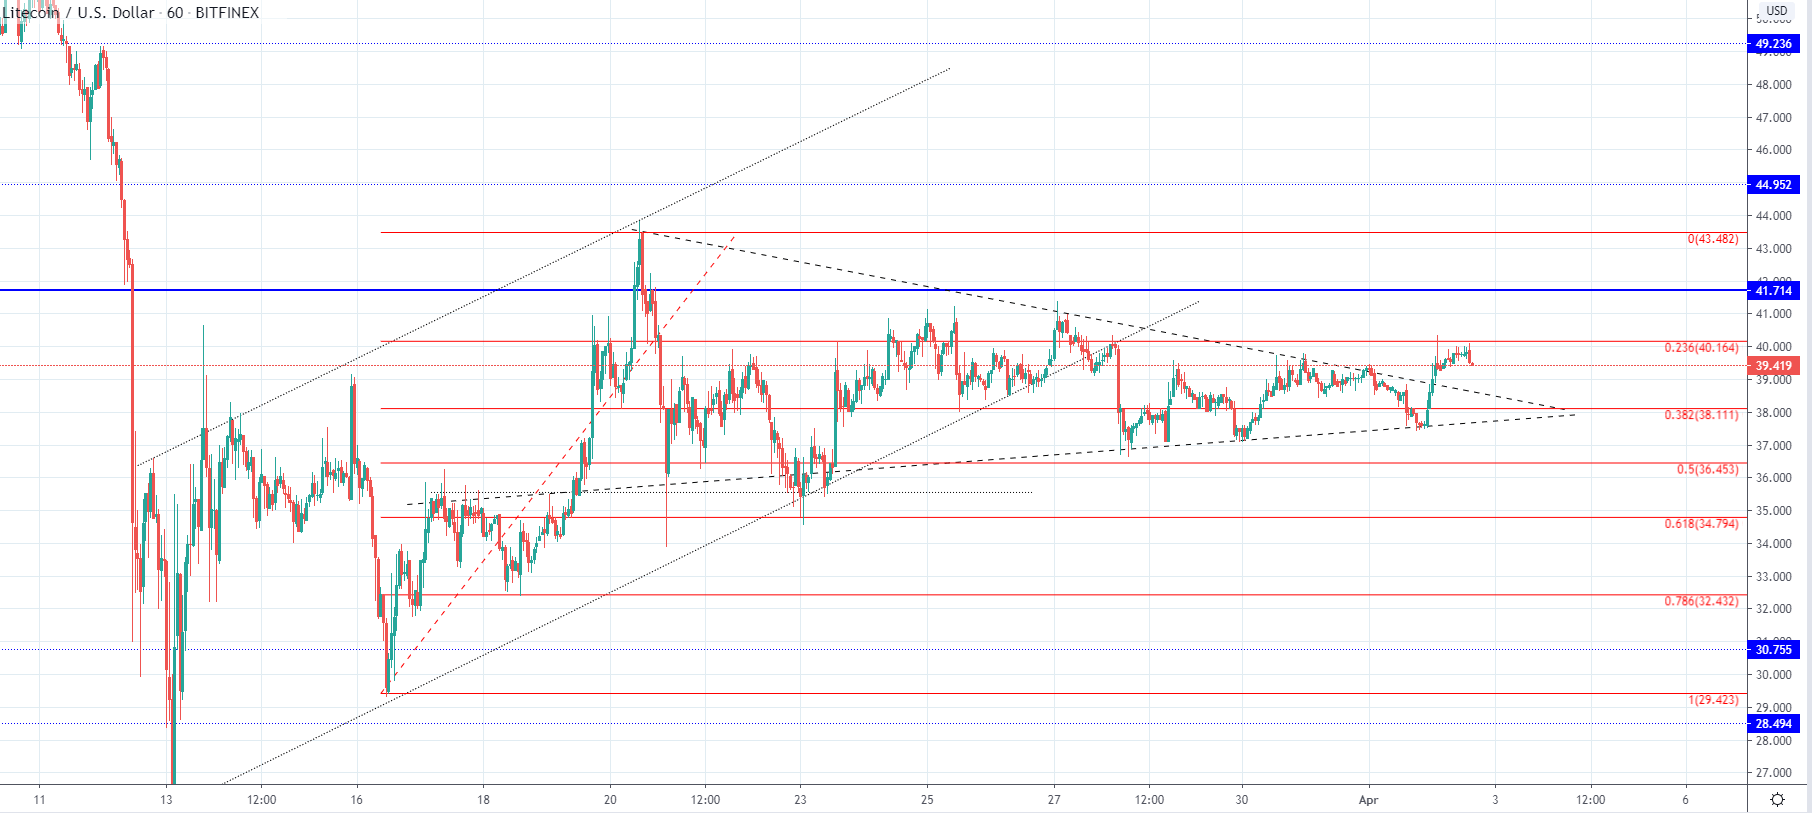 On the hourly chart, you can see that the price came up to the 0.236 Fibonacci level where it found resistance and is why we have seen a minor retracement. Previous to this the price increased exponentially and broke out from the descending trendline from the unconfirmed symmetrical triangle which could be interpreted as a bullish sign.
We haven’t seen the five-wave impulse wave to develop as after the then presumed 3rd wave that came to $43.48 we have seen the price starting to move in a sideways manner. The length of this sideways move makes it improbable of being the 4th wave which is why the count got invalidated, but it is still unclear which corrective structure this will turn out to be. For it looks like it might end with another increase to the upside and would be the 2nd three-wave correction after which another to the downside could be expected as the complex WXY correction develops.
If the price doesn’t continue moving above the 0.236 Fibonacci level I would be expecting a downside move below $37, but it looks more likely that from here we are to see further increase above the mentioned level in which case the next significant resistance level would be at $41.7.
EOS/USD
From yesterday’s low at $2.161 we have seen an increase of 6.82% in the price of EOS as it came up to $2.3 at today’s high. Like in the case of Litecoin it is currently expecting a minor retracement with further short-term downside potential.
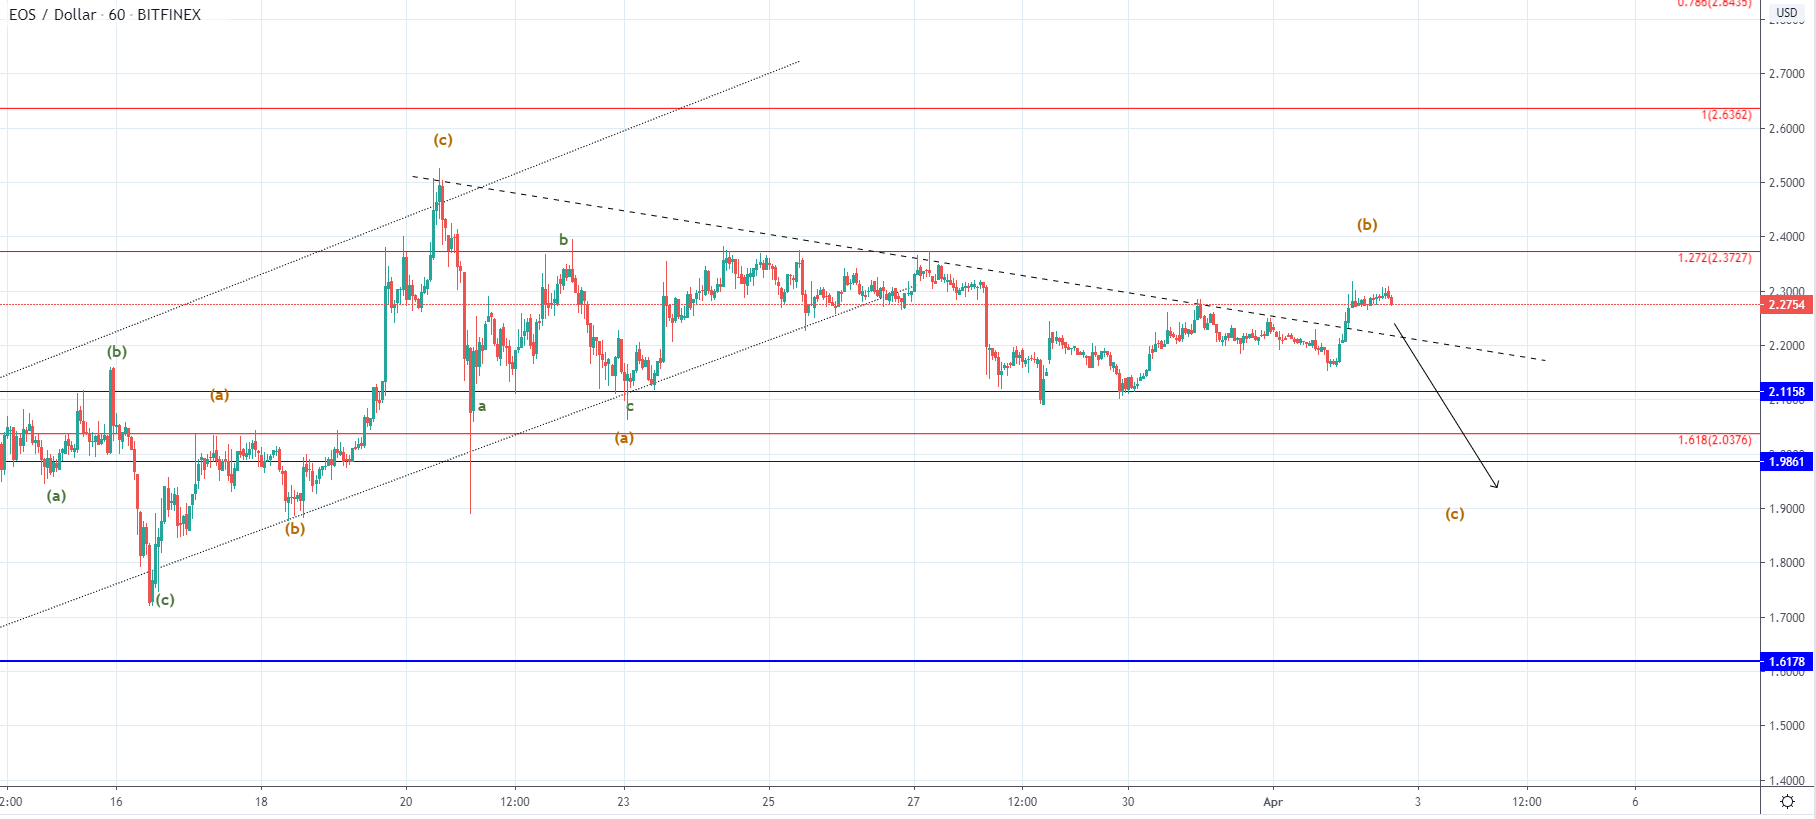 Looking at the hourly chart, you can see that the price broke out from the descending trendline and is interacting with the minor non-labeled horizontal level of the upper range between the 1.272 Fibonacci level. Like in the case of Litecoin we are most likely to see further upside movement after this retracement ends as a bullish momentum was strong enough to break the descending trendline, so the referred retracement may end as a retest of the descending trendline.
This is why if the price comes down to the descending trendline, and finds support on the retest I would be expecting further increase at least to the 1.272 Fibonacci level at $2.372. But if the price goes back below it I would be expecting a breakout to the downside below $2.11 level.
FXOpen offers the world's most popular cryptocurrency CFDs*, including Bitcoin and Ethereum. Floating spreads, 1:2 leverage — at your service. Open your trading account now or learn more about crypto CFD trading with FXOpen.
*At FXOpen UK and FXOpen AU, Cryptocurrency CFDs are only available for trading by those clients categorised as Professional clients under FCA Rules and Professional clients under ASIC Rules respectively. They are not available for trading by Retail clients.
This article represents the opinion of the Companies operating under the FXOpen brand only. It is not to be construed as an offer, solicitation, or recommendation with respect to products and services provided by the Companies operating under the FXOpen brand, nor is it to be considered financial advice.
Latest articles

META Share Price Collapses after Publication of Quarterly Report
Just yesterday, META's stock price closed at USD 493.50, up approximately 40% since the start of 2024 and up nearly 300% since the start of 2023.
However, following the release of Meta's quarterly report, its shares plummeted to USD

USD/JPY Analysis: The Rate Exceeds The Level of 155 Yen Per US Dollar
Today, the price of USD/JPY once again renewed its 34-year high, exceeding the level of 155 yen per dollar, which put pressure on the current authorities.
According to Reuters, officials are trying to maintain calm in the market.
"We

Yen in Search of New Lows, Commodity Currencies at a low Start
In recent trading sessions, the dollar has been trading quite differently to leading currencies. Thus, the yen is reaching historical lows, European currencies have managed to correct, and the Australian and Canadian dollars are testing strategic supports.
USD/JPY
The