


FXOpen
LTC/USD
From yesterday’s low at $51.7 the price of Litecoin has increased by 8.27% coming to $55.89 at its highest point today. Now the price is being traded slightly lower at around $55.5 but is still showing strong bullish momentum and is in an upward trajectory.
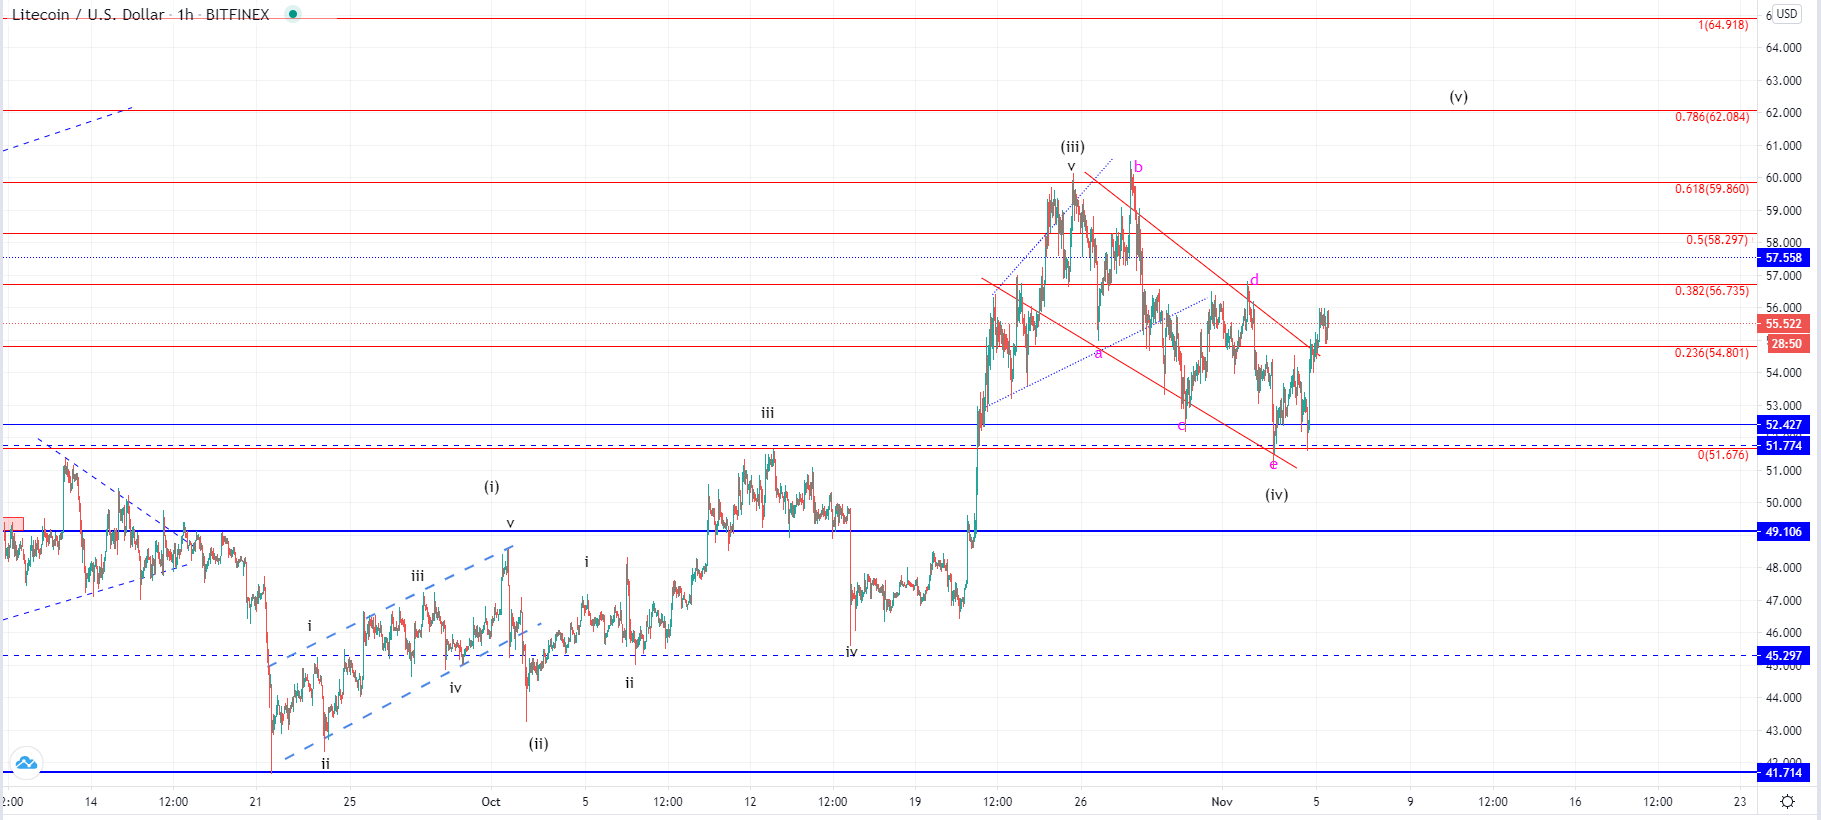
On the hourly chart, you can see that the price of Litecoin made an interaction with the 0 Fibonacci level at $51.67 on Tuesday from which it bounced but fell again yesterday for the second retest. As this second interaction ended by validating the support once more, a stronger move to the upside was seen. The price managed to move back up above the 0.236 Fibonacci line which served as another horizontal support level but was broken in a move to the downside.
As we have seen a significant recovery compared to the previous downfall from the interaction with the 0.382 Fib level, this could be an indication that the previous descending move ended. If this is true, then we have seen the completion of the ABCDE correction and the higher degree 4th wave. The descending trendline from its October’s high has been broken which could indicate that the development of the descending structure has been finished, so now if the price is developing its 5th wave we are to see a higher high then in October which was around $60.
EOS/USD
The price of EOS has increased by 5.73% from its yesterday’s low at $2.3 as it came up to $2.427 at its highest point today. Currently, a minor pullback has occurred with the price being traded at $2.378.
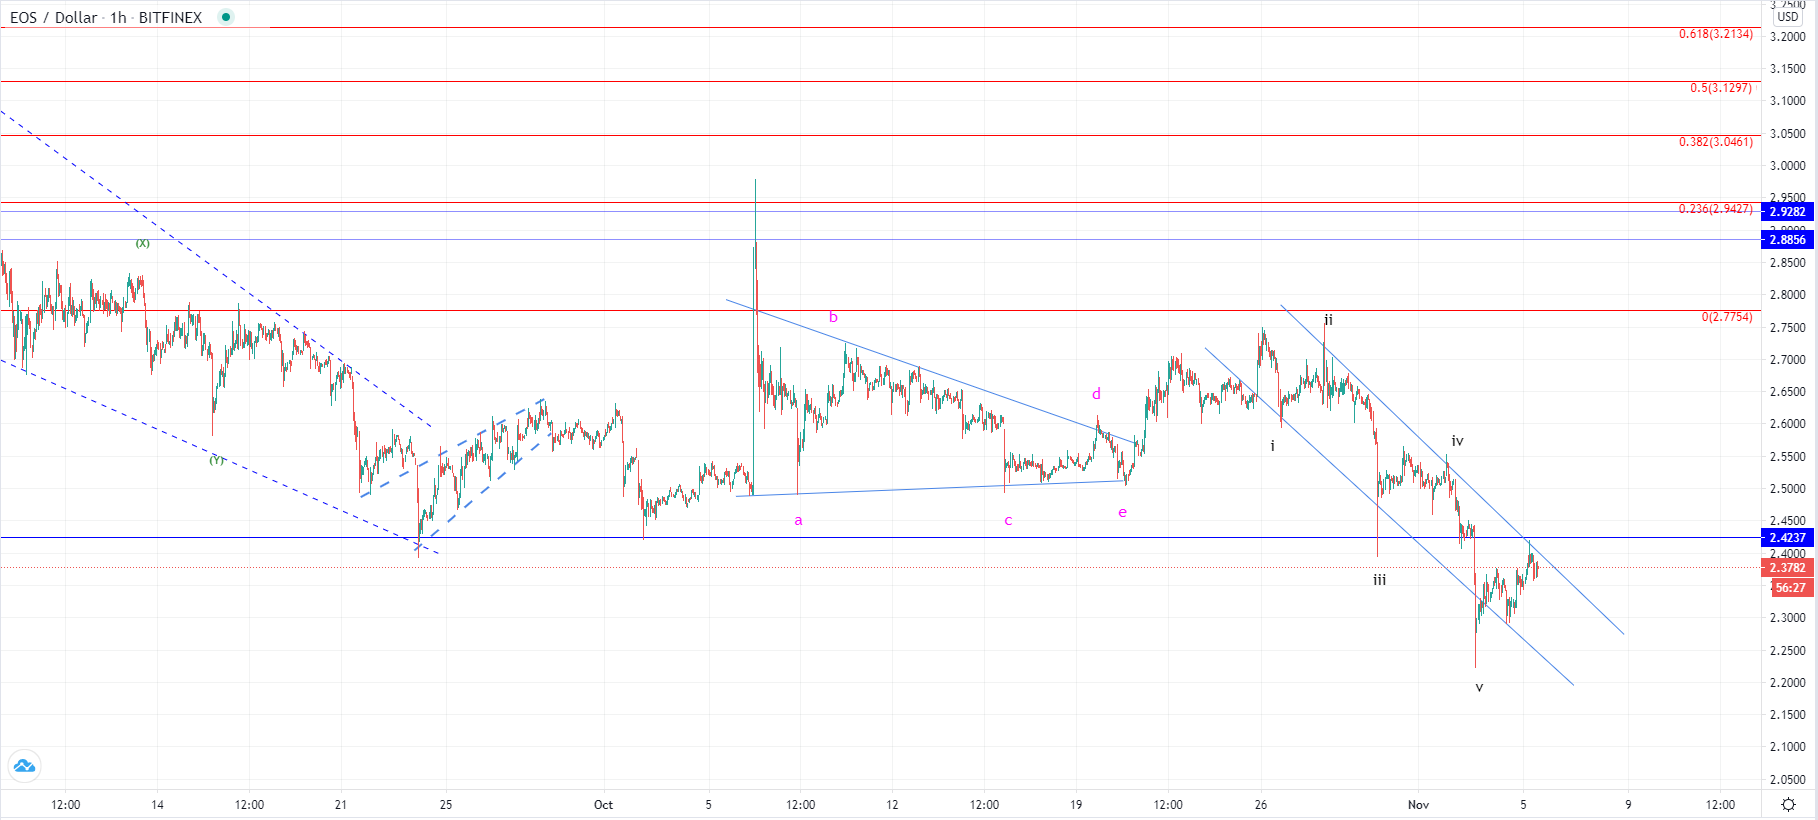
Looking at the hourly chart, you can see that the price broke down below the horizontal support at around $2.43 which was interacted with today from its lower side. This interaction most likely served as a validation of resistance and with a quick spike being made it appears that the resitance is present at those levels. The previous descending move was a five-wave one which could have been the C wave from the higher degree ABC correction of some kind, in which case the rise we have seen from yesterday could be the start of another significant recovery.
However, the price found resistance on the mentioned horizontal line and the descending channels resistance level exactly at the intersection which proved to be of significance. This is why we could have seen the completion of the 3rd of the higher degree count out of the five-wave impulse to the downside instead of the finishing C wave. In that case, the rise we have seen from yesterday would be the completion of the 4th wave and would indicate that another one to the downside is coming next.
If the price continues moving past the resistance point at the intersection of the significant lines, it would mean that the descending move ended, but if it get rejected from here, further lows would be more likely.
FXOpen offers the world's most popular cryptocurrency CFDs*, including Bitcoin and Ethereum. Floating spreads, 1:2 leverage — at your service. Open your trading account now or learn more about crypto CFD trading with FXOpen.
*At FXOpen UK and FXOpen AU, Cryptocurrency CFDs are only available for trading by those clients categorised as Professional clients under FCA Rules and Professional clients under ASIC Rules respectively. They are not available for trading by Retail clients.
This article represents the opinion of the Companies operating under the FXOpen brand only. It is not to be construed as an offer, solicitation, or recommendation with respect to products and services provided by the Companies operating under the FXOpen brand, nor is it to be considered financial advice.
Latest from Cryptocurrencies
Latest articles

Commodity Currencies at Strategic Levels. What Can Affect a Breakdown Downwards?
The decline in investor expectations regarding a change in the vector of the Fed's monetary policy contributes to the fall of not only European, but also commodity currencies. So, in recent weeks:
- AUD/USD has lost more than 200 points

Market Analysis: AUD/USD and NZD/USD Turn Red
AUD/USD declined below the 0.6500 and 0.6455 support levels. NZD/USD is also moving lower and might struggle to recover above 0.5950.
Important Takeaways for AUD/USD and NZD/USD Analysis Today
· The Aussie Dollar started

Since the Start of the Week, Brent Oil Price Has Dropped over 4%
At the beginning of the week, March 15, we wrote that the price of Brent oil could form a correction from the resistance level of USD 91 per barrel. Since then, the price has decreased by more than 4% due