


FXOpen

LTC/USD
The price of Litecoin has been on the rise from the 20th of July when it fell to $104 at its lowest point. From there we have seen an increase of 35.9% measured to its highest point today at $141.83. This last rise was made after a sharp impulsive decline in a slowly moving manner and even though it is still moving to the downside it barely made it past Monday’s high. 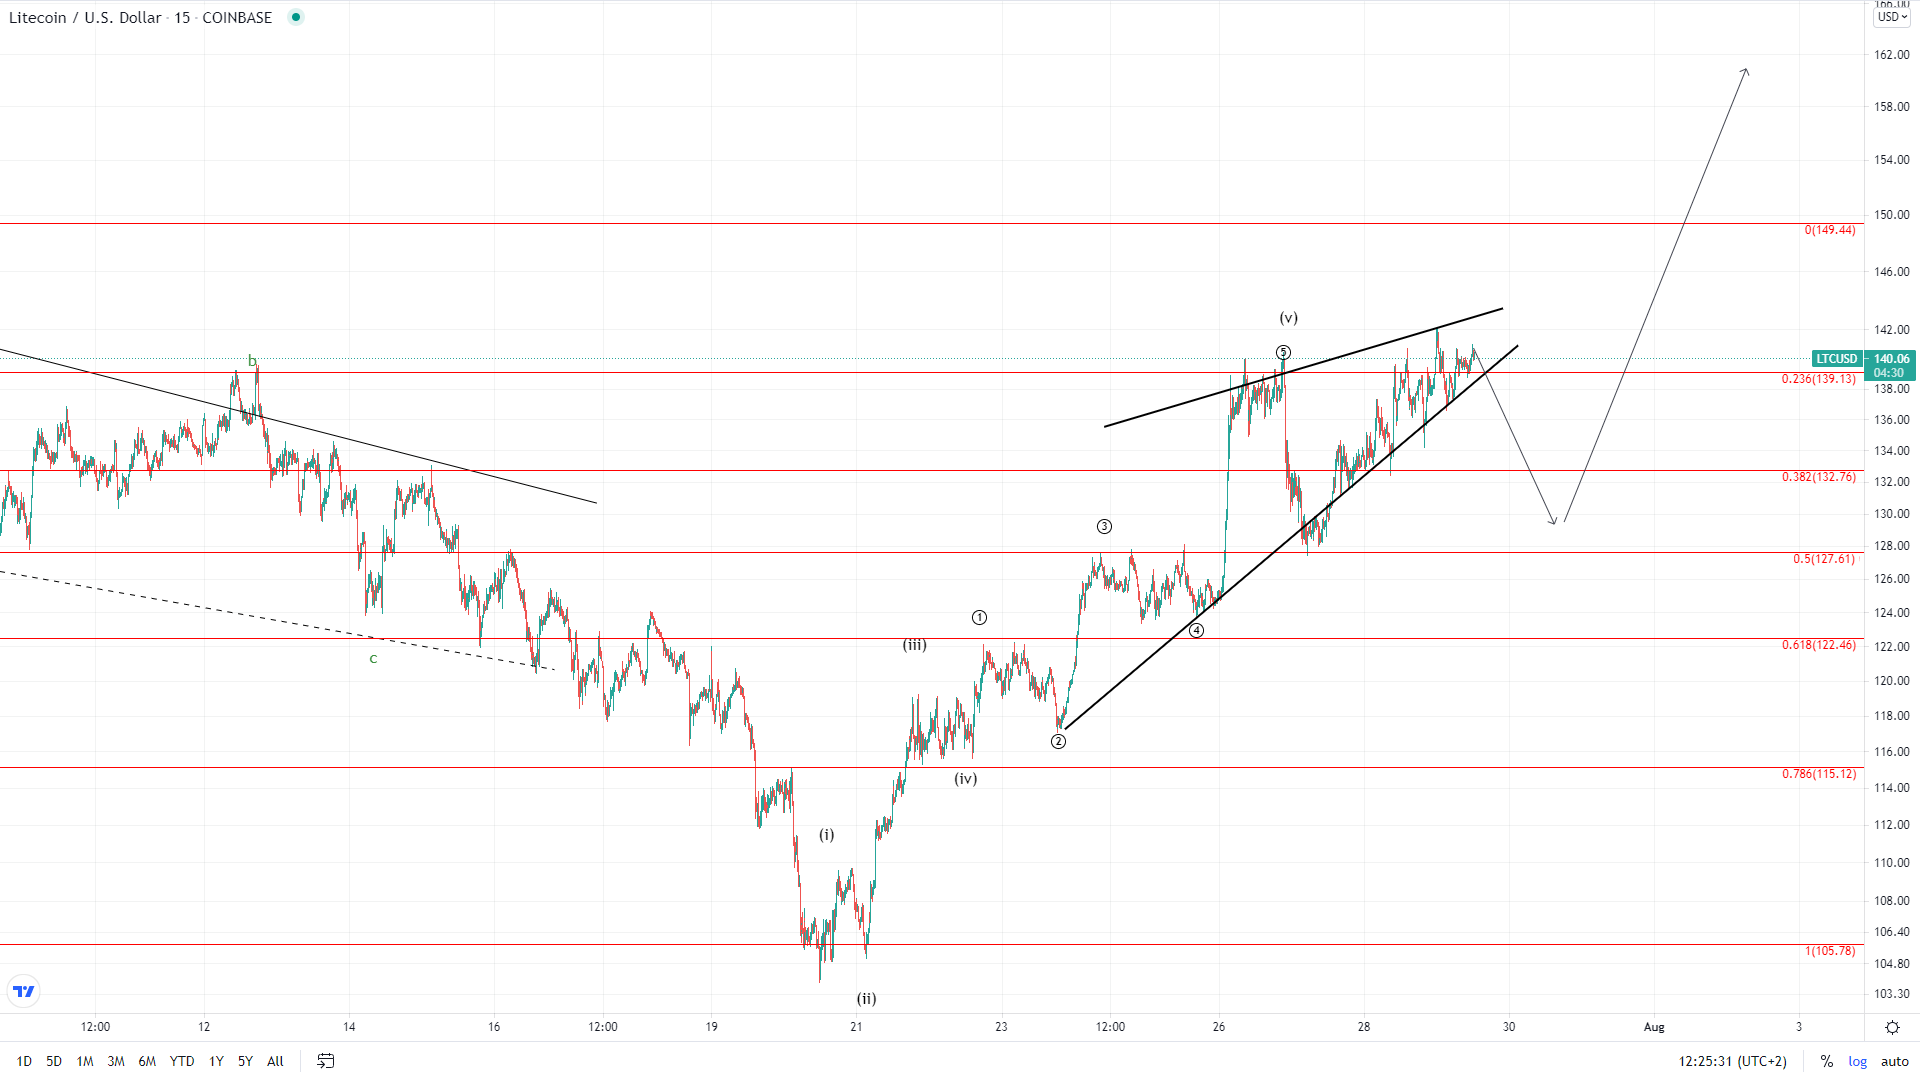 These two signs – slowly moving price after a sharp decline and failure to make a significantly higher high are considered signs of weakness which is why soon a move to the downside would be expected. From the 20th of July have likely seen the completion of the five-wave impulse to Monday’s high. If this is true, then from Monday we have seen the start of the descending move with the rise from Tuesday being its 2nd sub-wave.
This can be a minor three-wave flat correction with the price continuing its upward trajectory after as it made a slightly higher high compared to Monday’s one. Another possibility could be that this descending move is going to be larger but there aren’t still signs on how it can play out.
Considering the fact that this move is counted as corrective this structure can be labeled as the A wave from the higher degree ABC coun.
EOS/USD
EOS was also on the rise from the 20th of July when it was trading at $3.16 until Monday when it reached $4.01 making an increase of 26.87%. Unlike Litecoin who made a slightly higher high today to that on Monday, the price of EOS made the same high on the next rise yesterday.
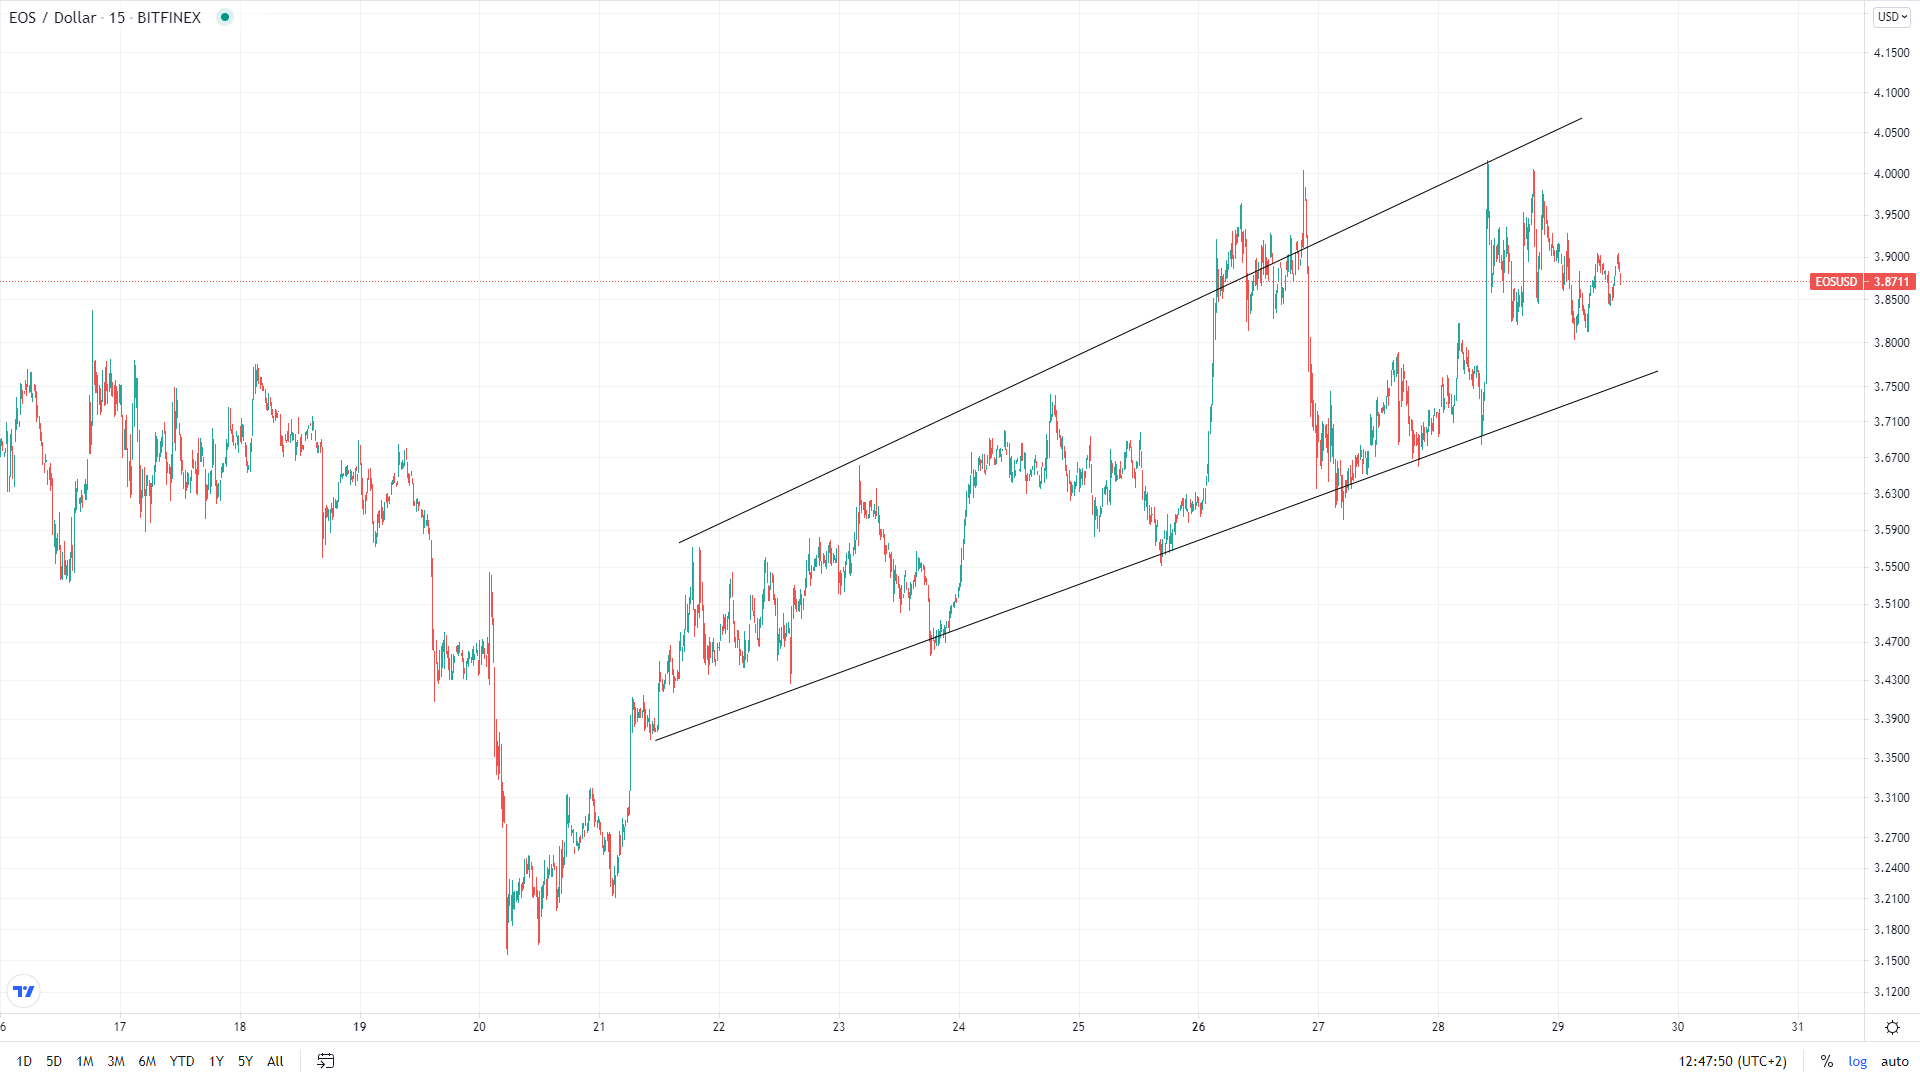 Currently, the price is being traded at $3.811 as it fell slightly to the downside which is yet another distinction with the price chart of Litecoin, but the biggest is the difference in the structure from the 22nd of July. Namely the on the EOS chart we have seen the formation of an ascending channel while most cryptos formed a clear ascending wave. This can further validate the assumption that this whole move from the 20th is a corrective one.
If we have seen the completion of the 1st wave most likely an A wave now the prices are undergoing a B wave correction. In the case of EOS this looks like a running flat correction but it is still unclear whether or not it ended.
This forecast represents FXOpen Markets Limited opinion only, it should not be construed as an offer, invitation or recommendation in respect to FXOpen Markets Limited products and services or as financial advice. Cryptocurrency CFDs are not available to trade in all jurisdictions.
FXOpen offers the world's most popular cryptocurrency CFDs*, including Bitcoin and Ethereum. Floating spreads, 1:2 leverage — at your service. Open your trading account now or learn more about crypto CFD trading with FXOpen.
*At FXOpen UK and FXOpen AU, Cryptocurrency CFDs are only available for trading by those clients categorised as Professional clients under FCA Rules and Professional clients under ASIC Rules respectively. They are not available for trading by Retail clients.
This article represents the opinion of the Companies operating under the FXOpen brand only. It is not to be construed as an offer, solicitation, or recommendation with respect to products and services provided by the Companies operating under the FXOpen brand, nor is it to be considered financial advice.
Latest articles

AUD/USD Analysis: Aussie Weakens After RBA Decision
Following its decision on 7th May, the Reserve Bank of Australia (RBA) opted to maintain the interest rate at 4.35%, despite inflation continuing to decrease at a slower pace than anticipated by the RBA.
"I think we still think

The Hang Seng Index Has Risen by Over 13% in 2 Weeks
Analyzing the Hang Seng (Hong Kong 50 at FXOpen) chart, we wrote on January 30th that the price was near an important support level formed by the lower boundary (shown in orange) of a long-term channel, which has been relevant

Turtle Trading: System, Rules, and Strategy
In the 1980s, the Turtle Trading system was born from a debate about whether trading skills were innate or could be taught. Richard Dennis and William Eckhardt decided to train novices in their trend-following trading strategies, thus giving rise to