


FXOpen

LTC/USD
The price of Litecoin has been increasing since last week and came up from $124.2 at its lowest point on Saturday to $170 at its highest on Monday. This week has started with a pullback to $147.2 but the price is back on the same levels as on Monday.
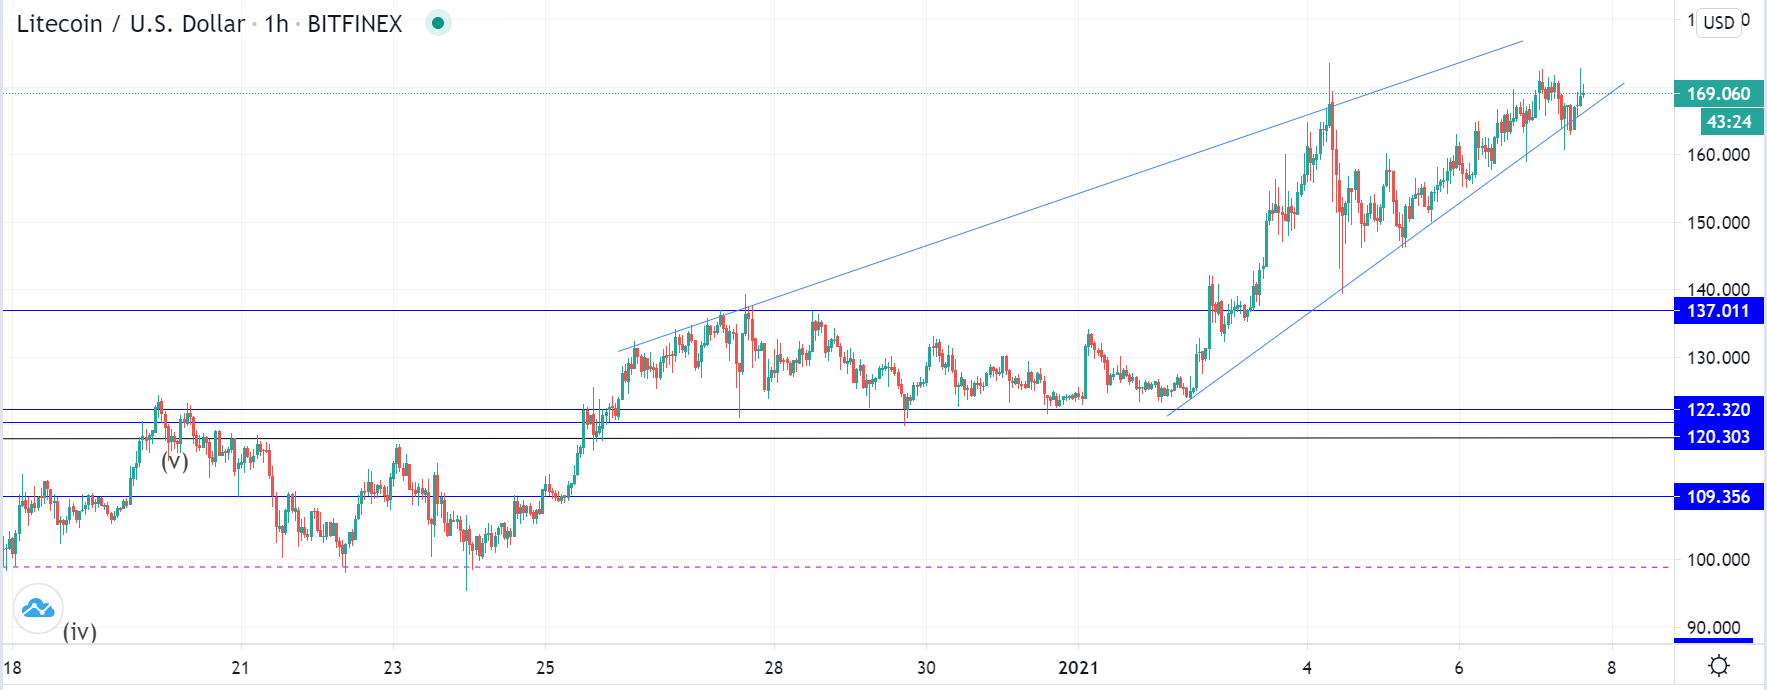
Looking at the hourly chart, you can see that the price made an interaction with the horizontal resistance found at the $170 level and fell back to its ascending trendline. As it found support there again it is currently making another breakout attempt.
If the price makes a higher high and continued moving past the $170 level it would serve as an early indication that the price is going to continue its bullish trajectory past the upper ascending trendline as well.
But if it fails to do so we might be seeing the completion of the higher degree ending diagonal which formed on the 24th of December. If this is the case then the currently seeing breakout attempt might end as a slightly higher high just making an interaction with the upper ascending trendline before we see a downturn.
However, currently, there are more signs of bullishness than bearishness which is why the uptrend continuation looks more likely.
EOS/USD
From the start of January when the price of EOS was sitting at $2.55 we have seen an increase of 35.68% measured to its highest point at $3.4617 made yesterday. Since then the price made a minor pullback to $3.11 but is now back above $3.315 again.
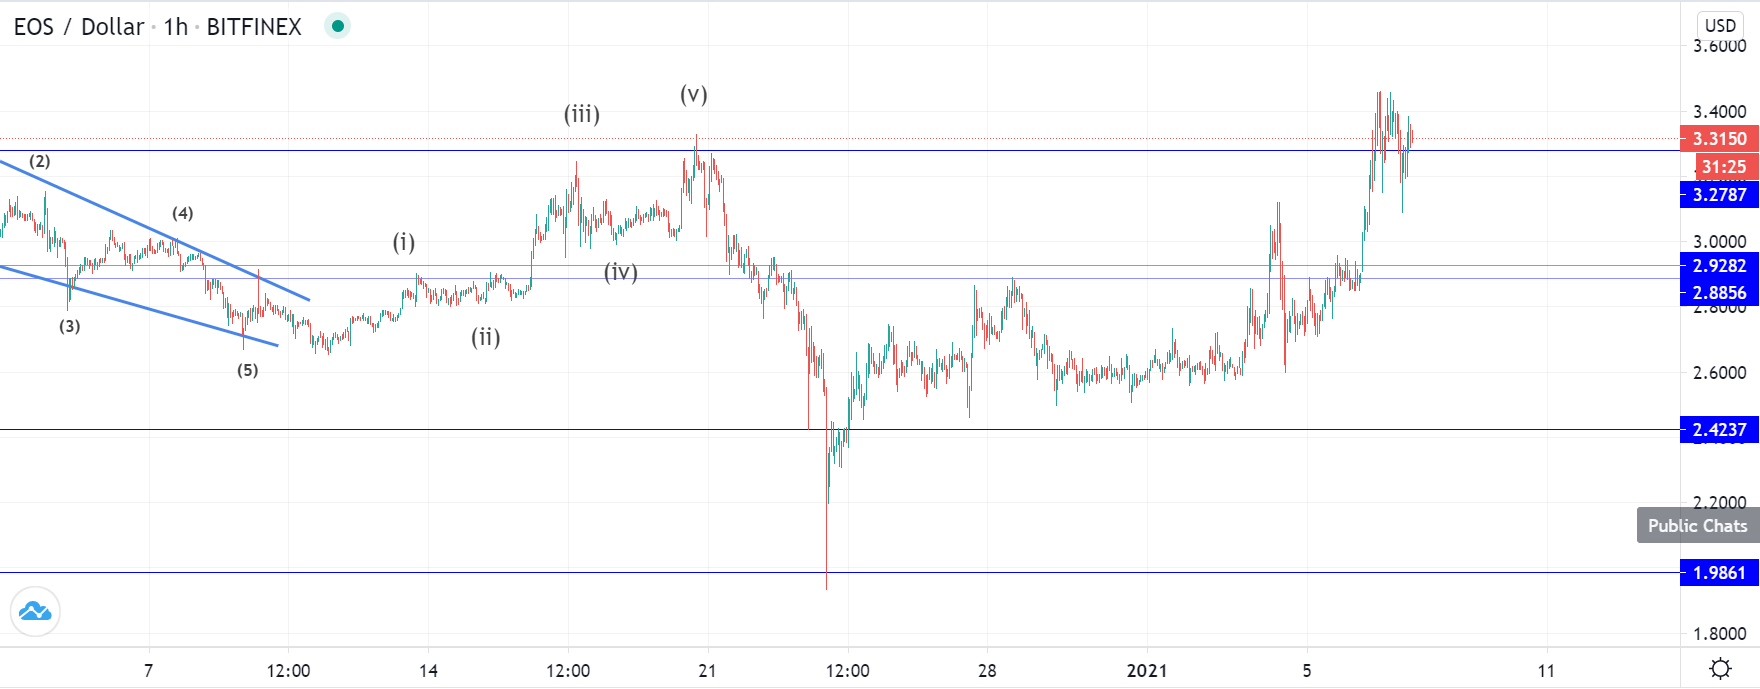
On the hourly chart, you can see that the price action made a cup and handle formation since the 20th of December and has now made a higher high compared to the one then. We are now seeing the formation of the handle pattern which is set to consolidate the price and establish support before it can move to the upside again.
From the start of the year, the price has moved parabolically to the upside so its upward trajectory would be expected to continue, but not before it makes a revisiting to the zone below $3.27. It could continue to its more significant horizontal zone at around $2.9 but that doesn’t look as likely considering the bullish momentum seen. More likely we are to see another spike to the downside like we have from yesterday’s high potentially coming to the $3 mark which is both a psychological level and the local horizontal support.
After this, a further upside would be expected for the price of EOS in the same impulsive manner as it did from the start of the new year. The next significant price point would be at $3.84 where the price made the previous high on November 25th.
FXOpen offers the world's most popular cryptocurrency CFDs*, including Bitcoin and Ethereum. Floating spreads, 1:2 leverage — at your service. Open your trading account now or learn more about crypto CFD trading with FXOpen.
*At FXOpen UK and FXOpen AU, Cryptocurrency CFDs are only available for trading by those clients categorised as Professional clients under FCA Rules and Professional clients under ASIC Rules respectively. They are not available for trading by Retail clients.
This article represents the opinion of the Companies operating under the FXOpen brand only. It is not to be construed as an offer, solicitation, or recommendation with respect to products and services provided by the Companies operating under the FXOpen brand, nor is it to be considered financial advice.
Latest articles

What Is the VIX Index, and How Is It Used in Trading?
The VIX Index serves as a key indicator of expected market volatility over the next 30 days, derived directly from S&P 500 options. Developed by the Chicago Board Options Exchange in 1993, it offers a simple way to

The Stock Price of PepsiСo (PEP) Is Retracting from Its Yearly High
On April 23, the quarterly report of PepsiCo's performance for the first quarter was published, which was awaited anxiously.
The issue stemmed from the fact that in December 2023, the U.S. Food and Drug Administration (FDA) announced the recall

The S&P 500 Index Has Reached a Significant Resistance Level
Analyzing the S&P 500 chart (US SPX 500 mini on FXOpen) on April 26, we wrote about how the April decline could be a correction to the lower boundary of the channel within the 2024 rally. Following this,