


FXOpen
LTC/USD
From yesterday’s high at $91.53 the price of Litecoin has decreased by 6.16% and is currently being traded at $86. The price started moving with strong momentum to the downside on yesterday’s interaction with the horizontal support level from the prior upper range and continued on during the day.
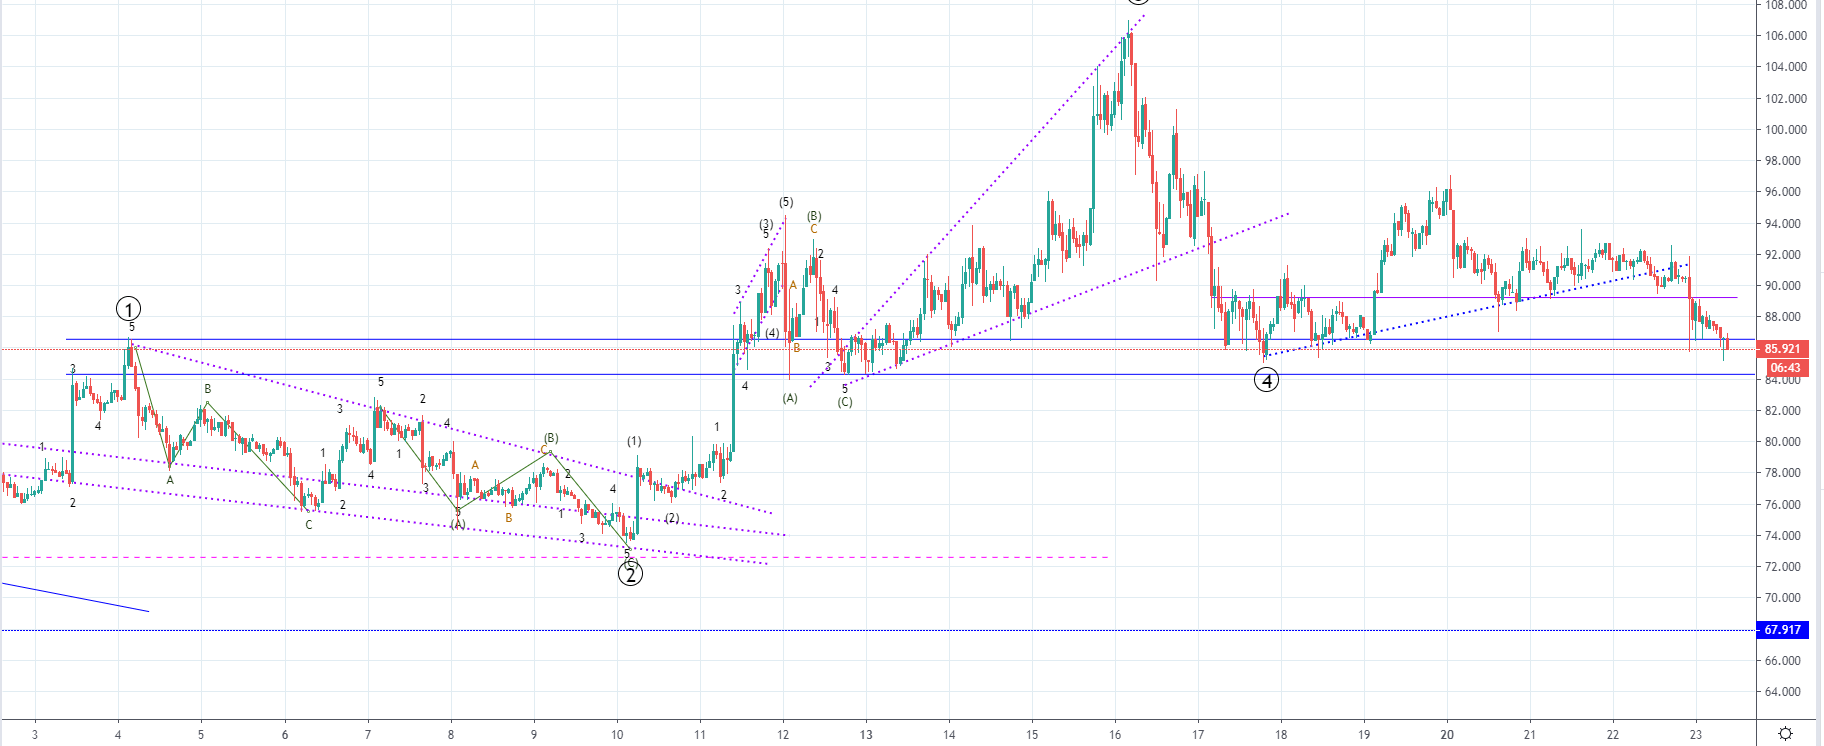
On the hourly chart, you can see that the price of Litecoin has started falling below the second horizontal support level at $86.4 which is the ending point of the 1st wave of a higher degree. This means that the increase seen over the weekend was corrective as it ended as a three-wave correction. This was validated by the price going below $90.5 which was the significant invalidation point.
We are now most likely seeing the development of another downside move like we’ve seen last week after Thursday’s high was reached. Since the recovery that followed was correctional it could mean that another five-wave impulsive move is coming of an equal length and would be the third wave out of the higher degree correction if we haven’t seen the end of the five-wave impulse to the upside.
If we have seen end of the five-wave impulse to the upside the movement could also be the 3rd wave from the higher degree five-wave move to the downside as well, in which case the price of Litecoin is set to go further lower below $84.2 which is the second horizontal level below which is the starting point of the second wave of the higher degree move which the price cannot enter on the 4th.
EOS/USD
From yesterday’s high at $6.334 the price of EOS has fallen by 9.64% as it came down to $5.72 at its lowest point today above which it is currently being traded.
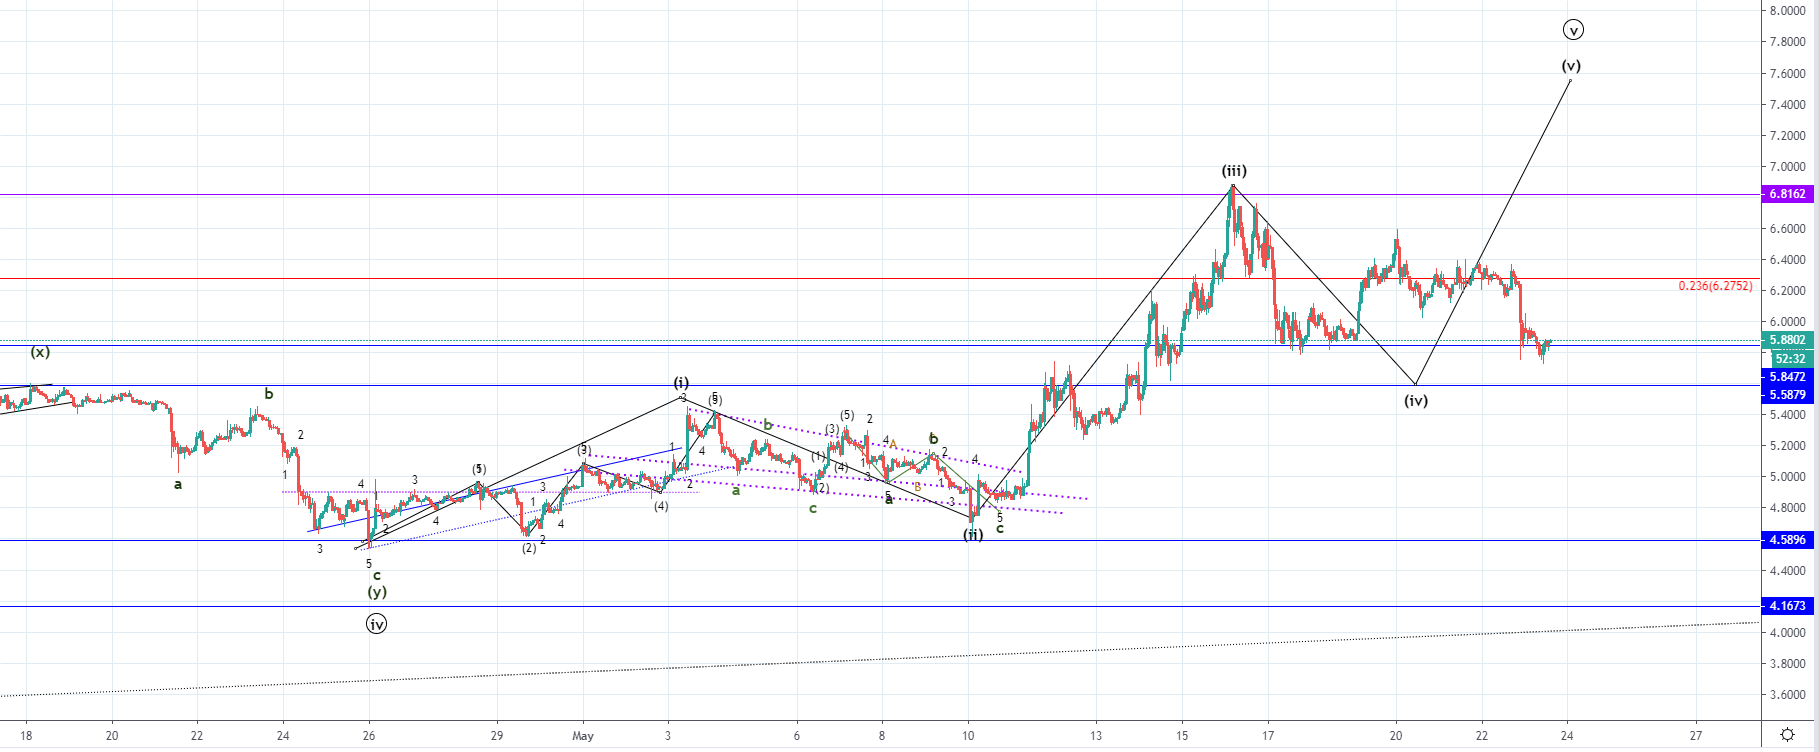
Looking at the hourly chart, you can see that the price of EOS fell to the significant horizontal support level from the previous drop but came slightly below it and is currently retesting it from the upper side again. This could be an early indication that the price is headed lower to the next horizontal support level at $5.58 before the end of the downward move or even for a breakout to the downside.
We are most likely seeing the 4th wave from the five-wave move to the upside which is corrective in nature and after its completion another increase would be expected, unless the price continues moving down from here and goes below $5.34 which is the ending point of the 1st wave in which the price can’t enter on the 4th. If this price finds support higher then the mentioned level and starts increasing impulsively again the 5th wave would be expected to push the price above the prior high made on last Thursday which is at $6.81.
FXOpen offers the world's most popular cryptocurrency CFDs*, including Bitcoin and Ethereum. Floating spreads, 1:2 leverage — at your service. Open your trading account now or learn more about crypto CFD trading with FXOpen.
*At FXOpen UK and FXOpen AU, Cryptocurrency CFDs are only available for trading by those clients categorised as Professional clients under FCA Rules and Professional clients under ASIC Rules respectively. They are not available for trading by Retail clients.
This article represents the opinion of the Companies operating under the FXOpen brand only. It is not to be construed as an offer, solicitation, or recommendation with respect to products and services provided by the Companies operating under the FXOpen brand, nor is it to be considered financial advice.
Latest articles

Anchored VWAP and How You Can Use It in Forex Trading
In the world of forex trading, understanding the nuanced tools at your disposal can significantly enhance decision-making processes. One such sophisticated tool is the Anchored Volume-Weighted Average Price (Anchored VWAP), which refines the standard VWAP by allowing traders to set

META Share Price Collapses after Publication of Quarterly Report
Just yesterday, META's stock price closed at USD 493.50, up approximately 40% since the start of 2024 and up nearly 300% since the start of 2023.
However, following the release of Meta's quarterly report, its shares plummeted to USD

USD/JPY Analysis: The Rate Exceeds The Level of 155 Yen Per US Dollar
Today, the price of USD/JPY once again renewed its 34-year high, exceeding the level of 155 yen per dollar, which put pressure on the current authorities.
According to Reuters, officials are trying to maintain calm in the market.
"We