


FXOpen

LTC/USD
From the 3rd of January when the price of Litecoin was sitting at $38.9 we have seen an increase of over 52% as it came to $59.34 at its highest point yesterday. Currently, the price is being traded slightly lower at around $55.6 as the price started moving to the downside again.
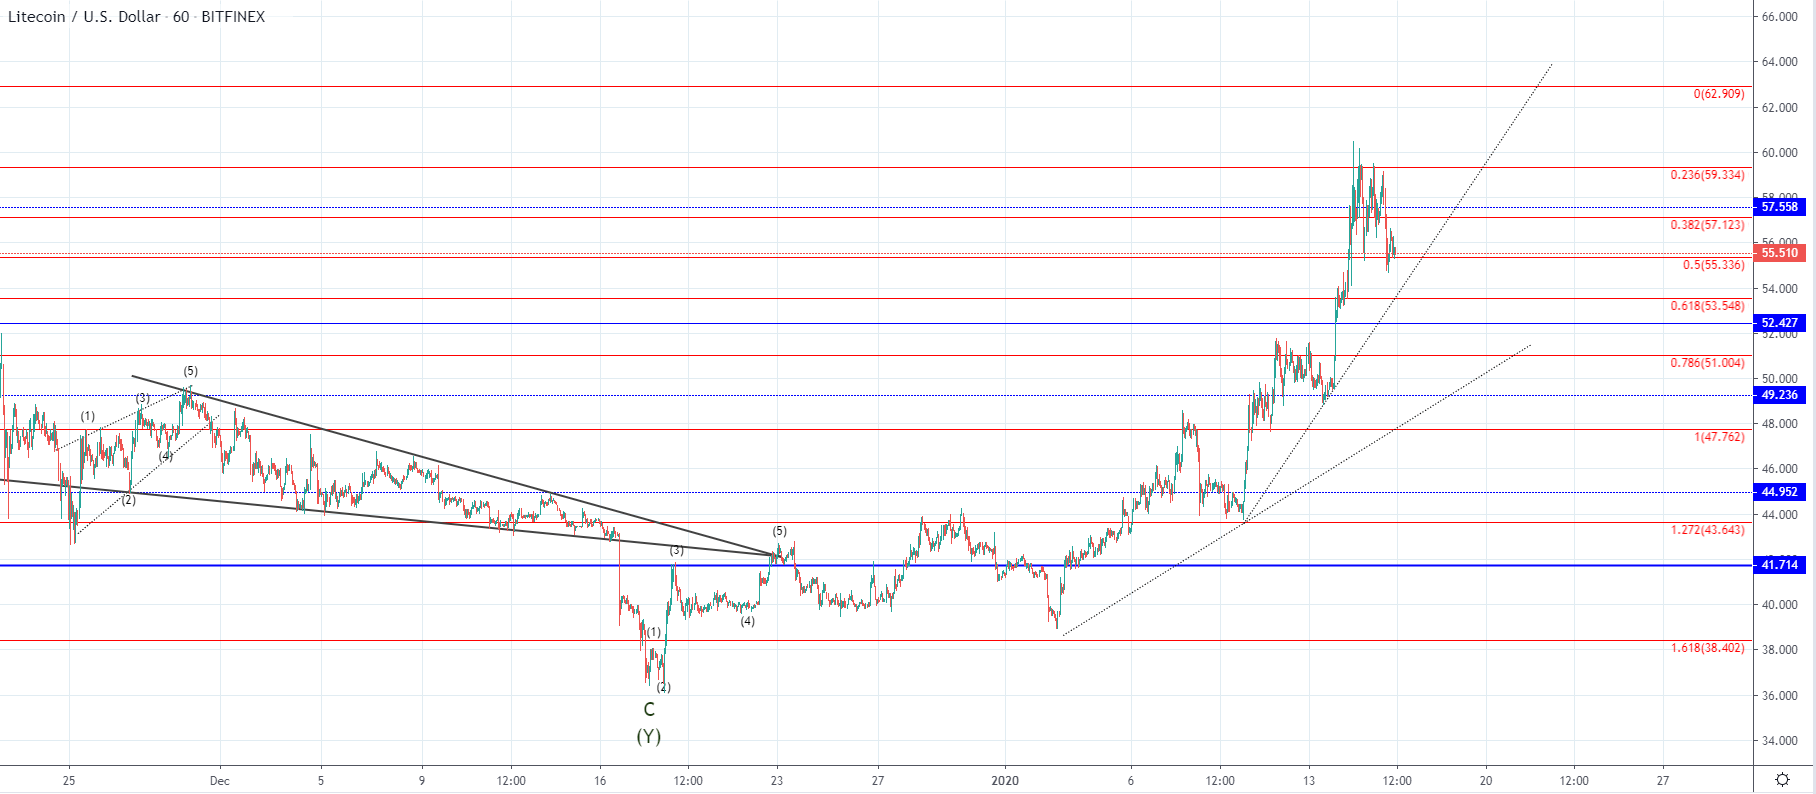 Looking at the hourly chart, you can see that the price of Litecoin started increasing exponentially after an interaction with the $49.23 horizontal level which formed another steeper ascending trendline. As we have most likely seen the completion of the Y wave from the WXY correction of a higher degree the increase was seen is the start of a higher degree recovery to the upside.
From the 3rd of January when we saw a first retracement ending on a higher low so it could have been the 1st wave out of the presumed five-wave impulse to the upside. If this is true then we are most likely seeing the development of its 3rs wave but considering that the price increase from the 1.272 Fibonacci level until the 0.786 was smaller in size compared to the previous one this is yet to be validated.
Another possibility could be that we are seeing the second wave X as the correction of a higher degree could have gotten prolonged in which case the currently seen rise would be sub-divided into three waves.
EOS/USD
On the EOS chart, you can see a similar picture as in the case of Litecoin, as this cryptocurrency also experienced an exponential increase from the start of the year. From the 3rd of January when the price was sitting at $2.44 we have seen an increase of 65.82% measured to the highest point the price has been which is at around $4 made Tuesday this week.
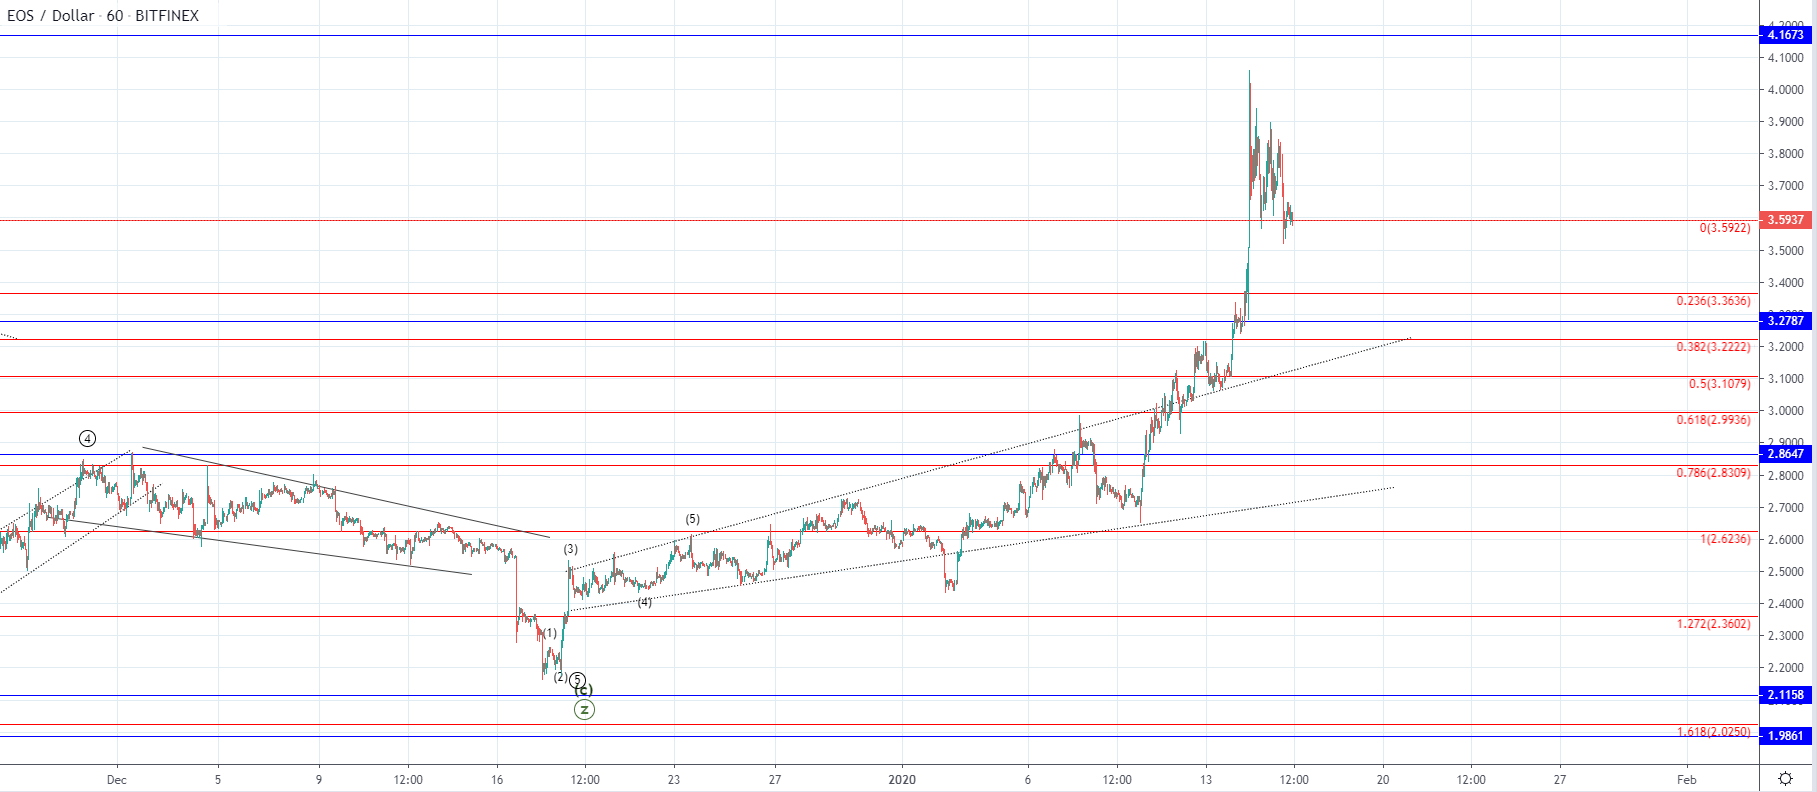 On the hourly chart, you can see that the price is currently being traded at $3.6 and is retesting the 0 Fib level for support which is the significant ending point of the upper range and serves as a pivot point. As the price spiked inside the territory of the upper range and managed to stay above the 0 Fibonacci line it could mean that further increase is highly probable but if the price falls below the mentioned level further decrease would look more likely.
If the price is to continue increasing from here the next significant level would be at around $4.16 but if it continues decreasing from here I could fall back below $3 mark again.
FXOpen offers the world's most popular cryptocurrency CFDs*, including Bitcoin and Ethereum. Floating spreads, 1:2 leverage — at your service. Open your trading account now or learn more about crypto CFD trading with FXOpen.
*At FXOpen UK and FXOpen AU, Cryptocurrency CFDs are only available for trading by those clients categorised as Professional clients under FCA Rules and Professional clients under ASIC Rules respectively. They are not available for trading by Retail clients.
This article represents the opinion of the Companies operating under the FXOpen brand only. It is not to be construed as an offer, solicitation, or recommendation with respect to products and services provided by the Companies operating under the FXOpen brand, nor is it to be considered financial advice.
Latest articles

Anchored VWAP and How You Can Use It in Forex Trading
In the world of forex trading, understanding the nuanced tools at your disposal can significantly enhance decision-making processes. One such sophisticated tool is the Anchored Volume-Weighted Average Price (Anchored VWAP), which refines the standard VWAP by allowing traders to set

META Share Price Collapses after Publication of Quarterly Report
Just yesterday, META's stock price closed at USD 493.50, up approximately 40% since the start of 2024 and up nearly 300% since the start of 2023.
However, following the release of Meta's quarterly report, its shares plummeted to USD

USD/JPY Analysis: The Rate Exceeds The Level of 155 Yen Per US Dollar
Today, the price of USD/JPY once again renewed its 34-year high, exceeding the level of 155 yen per dollar, which put pressure on the current authorities.
According to Reuters, officials are trying to maintain calm in the market.
"We